
Shopify Stockouts and In-Stock Rate
 Analytics Spreadsheet Updated October 6, 2026
 On this page
A product that’s out of stock can’t sell, and Shopify’s sales reports can’t show you what didn’t happen. These six inventory metrics in Mixtable Analytics Spreadsheet show how often each variant sold out, for how long, and roughly what those days cost you, calculated from your store’s daily stock history.
| Metric | What it shows |
|---|---|
| Days In Stock | Days in the period the variant ended with stock |
| Days Out of Stock | Days in the period the variant ended at zero or below |
| In-Stock Rate | The share of days that ended with stock |
| Out-of-Stock Variants | How many variants were out of stock at the end of the day |
| Last In-Stock Date | The last day the variant ended with stock |
| Estimated Lost Sales | The Net Sales a variant probably missed while it was out of stock |
They are part of Mixtable’s 18 inventory metrics. For where the numbers come from, how the history downloads, and the date rules every inventory metric follows, start with the Shopify inventory analytics guide.
When a day counts as out of stock
Every metric on this page asks the same question about each variant and each day: did the day end with stock?
- In stock: the variant’s stock at the end of the day, added up over the stock locations you count, was above zero
- Out of stock: it was zero or below. Overselling counts as out of stock
- Neither: the variant had no stock record that day, for example because it didn’t exist yet or was never stocked at the locations you count
Locations are added up first. A variant oversold by 2 units at one location with 1 unit at another ended the day at −1, so it was out of stock. With 3 units at the other location, it ended at 1 and was in stock.
Mixtable looks at the stock at the end of each day, so a variant that sold out at noon and was restocked by evening counts as in stock that day.
Days In Stock and Days Out of Stock
Days In Stock = the days in the period that ended with stock
Days Out of Stock = the days in the period that ended at zero or below
For example, over a 30-day September, a variant that ended 22 days with stock and 8 days with none has 22 Days In Stock and 8 Days Out of Stock. The two only add up to the days in the period if the variant had a stock record every day.
Both are counted per variant, so they’re only available on Products (with variants) worksheets.
In-Stock Rate
In-Stock Rate = Days In Stock ÷ (Days In Stock + Days Out of Stock)
For the variant above, that’s 22 ÷ 30 = 73.33%.
On a product, collection, or report row, In-Stock Rate pools every variant’s days together rather than averaging each variant’s rate. A product with three sizes over 30 days, where Small was in stock all 30 days, Medium 20, and Large 10, has an In-Stock Rate of (30 + 20 + 10) ÷ 90 = 66.67%. Variants with more recorded days carry more weight.
When In-Stock Rate adds up a collection, a report row, or the whole store, it counts only products that are for sale, which means active or unlisted. Draft and archived products would otherwise drag the rate down for stock you never meant to sell. A product row always counts all of its own variants, whatever its status.
If no variant has a stock record in the period, the cell shows No inventory history.
Out-of-Stock Variants
Out-of-Stock Variants = the number of variants that ended the day at zero or below
Out-of-Stock Variants describes a single day, so its column settings ask On what date?. Pick Rolling date and Yesterday for a count that updates every day.
It counts variants, so it needs a row that holds several: a product, a collection, a report row, or a Location row, where it counts the variants that were out of stock at that location. Collection, report, and store totals count only products for sale, while a product row counts all of its variants.
Last In-Stock Date
Last In-Stock Date = the last day, on or before the chosen day, that ended with stock
Last In-Stock Date describes a single day and searches all of your downloaded history before it. It shows:
- A date such as 2026-08-14 when the variant was out of stock at the end of the chosen day
- In stock when the variant ended the chosen day with stock
- Before 2023-10-01 when it had no stock at any point in the history. The date is the first day of your store’s history, so a store created later shows its own first day
On a product, it shows the latest date among the product’s current variants, so it reads In stock if any variant had stock. It is available on Products (with variants) and Products (no variants) worksheets.
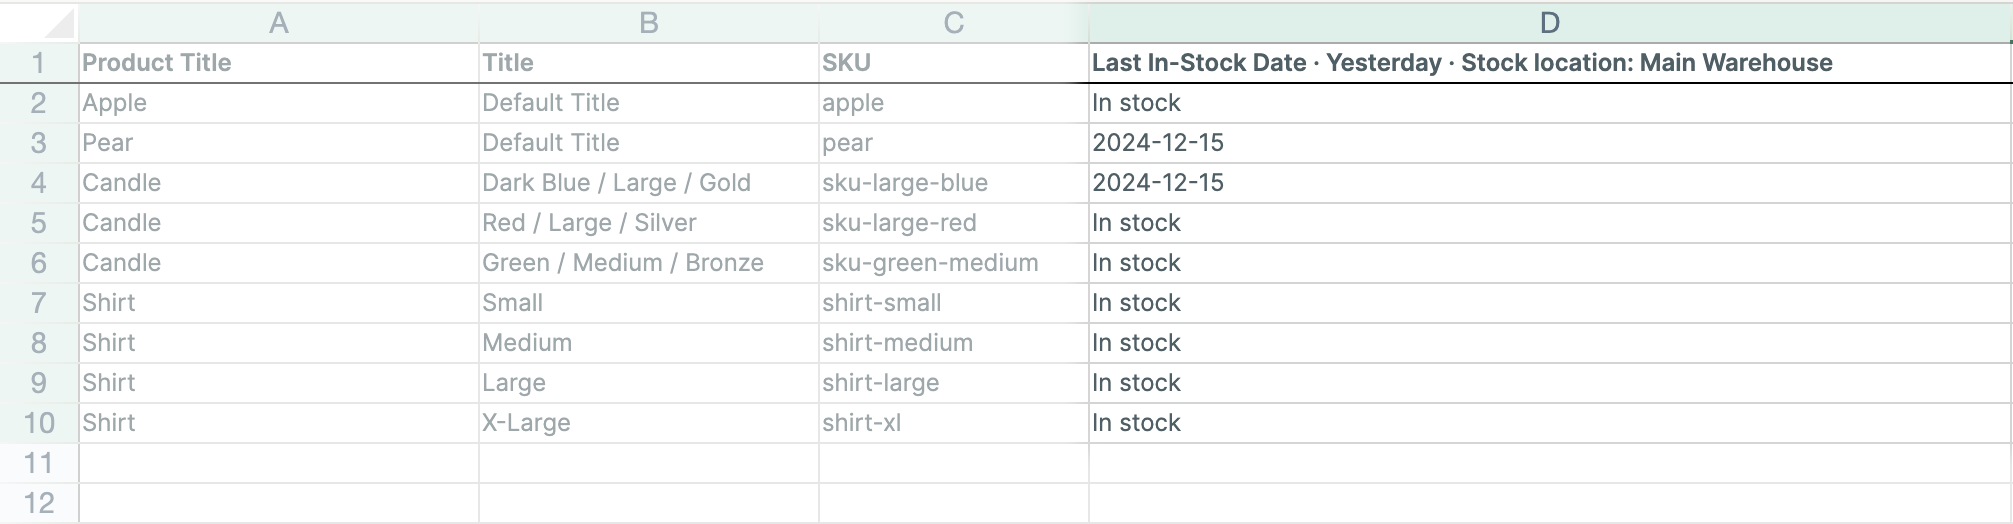
Sort a Products (with variants) worksheet by a Last In-Stock Date · Yesterday column to find the variants that have been out of stock the longest. See sorting Shopify data in Mixtable.
Estimated Lost Sales
Estimated Lost Sales = Days Out of Stock × (Net Sales ÷ Days In Stock)
Estimated Lost Sales assumes a variant would have kept selling on its out-of-stock days at the pace it sold on its in-stock days. For example, a variant with $1,200 in Net Sales over a 30-day period, in stock for 24 days and out for 6, sold at $1,200 ÷ 24 = $50 per in-stock day. Its Estimated Lost Sales is 6 × $50 = $300.00.
- Net Sales is the same Net Sales Mixtable calculates from your orders, over the same days. It includes any sales made while the variant was out of stock, such as oversold orders
- No pace, no estimate: a variant with no in-stock days or no Net Sales in the period shows 0
- Every location: Estimated Lost Sales always counts every stock location, because sales aren’t split by location
- Groups: a product, collection, or report row adds up each variant’s own estimate. Collection, report, and store totals count only products for sale
Treat it as an estimate, not a forecast. Demand on the missing days may have been higher or lower than average, for example during a promotion or a slow season, and some shoppers buy another size or color instead. It’s most useful for ranking which stockouts mattered most.
Where you can use these metrics
| Metric | Variants | Products | Collections | Report rows | Location rows |
|---|---|---|---|---|---|
| Days In Stock | Yes | No | No | No | No |
| Days Out of Stock | Yes | No | No | No | No |
| In-Stock Rate | Yes | Yes | Yes | Yes | Yes |
| Out-of-Stock Variants | No | Yes | Yes | Yes | Yes |
| Last In-Stock Date | Yes | Yes | No | No | No |
| Estimated Lost Sales | Yes | Yes | Yes | Yes | No |
Variants and Products are Products (with variants) and Products (no variants) worksheets. Report rows are Pivot Table and Time Series rows for a vendor, product type, product category, or product tag, and Store rows.
Find the stockouts that cost you the most
An analytics column puts stockout numbers beside each variant’s SKU, vendor, and current inventory.
-
Open a Products (with variants) worksheet. To add one, click the + at the end of the worksheet tabs, or choose Worksheet > Add worksheet…
-
Click + Shopify data in the header row of an empty column, or choose Column > Add Shopify data… from the menu bar. The field picker opens
-
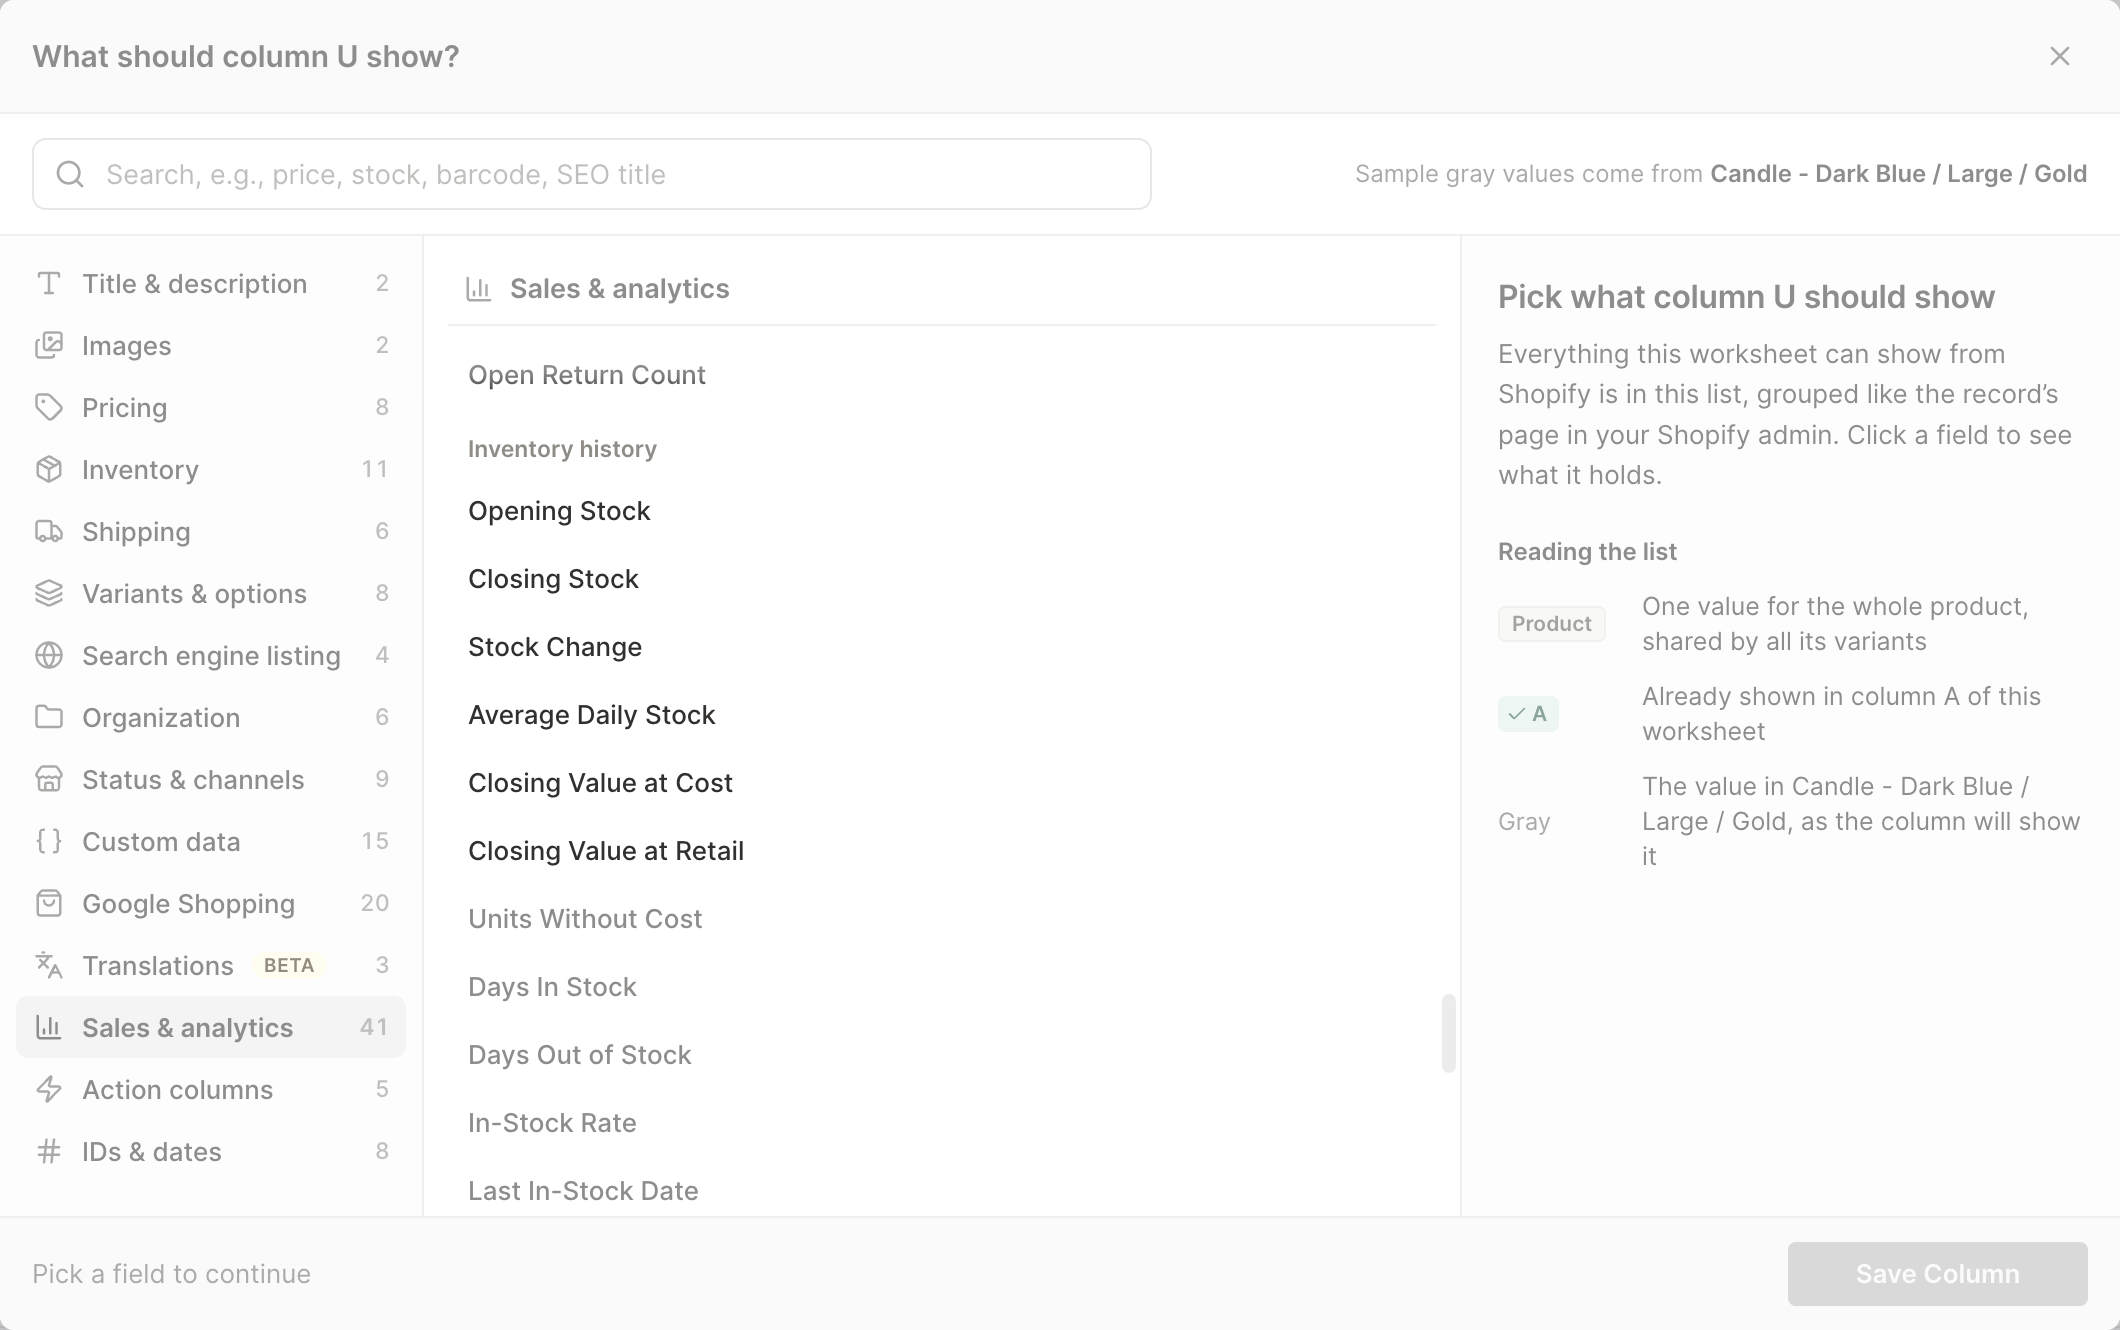
Click Sales & analytics in the list of sections on the left, then scroll down to the Inventory history group. You can also type part of the metric's name in the search box
-
Click Estimated Lost Sales. The metric's settings open with it already chosen under Which metric?
-
Pick the dates. Most metrics ask Over what time period?: choose Fixed dates, Rolling period, Calendar year, or Calendar month, then pick the dates. Metrics that describe a single day ask On what date? instead: choose Fixed date, Rolling date, Calendar year, or Calendar month, then pick the day
-
Under Which stock locations count, leave it as it is to count every location. To count only some, click + Add filter, choose Stock location, and pick a location. Click + Add filter again to add another one. Days of Stock Left, Estimated Lost Sales, Sell-Through Rate, and Inventory Turnover always count every location, because sales aren't split by stock location, so this step has nothing to pick for them
-
Click Save Column
For Over what time period?, choose Rolling period and Last 60 days, for example. Then add Days Out of Stock for the same period the same way, and sort the worksheet by Estimated Lost Sales from largest to smallest. The variants at the top are the ones to reorder sooner or stock deeper.
Days In Stock, Days Out of Stock, In-Stock Rate, and Estimated Lost Sales cover a period. Out-of-Stock Variants and Last In-Stock Date describe a single day and ask On what date?. For the full list of date choices, see the inventory analytics guide.
Track availability by vendor or location
To see whether a supplier keeps you in stock, follow In-Stock Rate week by week with a Time Series worksheet:
- Click the + at the end of the worksheet tabs, or choose Worksheet > Add worksheet…
- Select Reporting worksheet, then click Continue
- Under Start from scratch, select Blank time series, then click Continue
- Under Break down by, choose Vendor for one row per vendor, or Location for one row per stock location
- Under Measure, select In-Stock Rate from the Inventory group
- Under Time periods, choose By week, then choose how many weeks under for the last
- Click Create Worksheet
Each column is one week, Sunday to Saturday. For a snapshot instead, create a Pivot Table worksheet broken down by Location with In-Stock Rate and Out-of-Stock Variants to compare your warehouses and shops side by side. See create a Pivot Table worksheet for Shopify data.
Before you rely on the numbers
- Inventory tracking: Mixtable only has history for variants that track inventory in Shopify. Variants that don’t track it show No inventory history. See enable Shopify inventory tracking
- Dates: Shopify keeps inventory history from October 1, 2023, and every period ends yesterday at the latest, because today’s stock isn’t final until the day ends
- Made-to-order and preorder items: variants that sell at zero stock on purpose show as out of stock, so leave them out when you compare
Next, see how well your stock turns into sales in Shopify sell-through rate, inventory turnover, and dead stock, or what it’s worth in Shopify stock levels and inventory value.