


Shopify Analytics Timeframes and Date Ranges
Shopify Analytics Timeframes and Date Ranges
The timeframe controls which Shopify order activity contributes to an analytics metric. Choosing the right option matters because last month, past month, and last 30 days can describe different dates even though they sound similar.
Why the timeframe is the setting to get right
Picking the wrong dates is the easiest way to reach a confident, wrong conclusion. Two reports on the same metric can disagree completely, and the reason is usually the dates rather than the data.
Two traps catch people most often.
Comparing a partial period with a complete one. On the 8th of the month, “this month” holds eight days of sales. Put it next to a full prior month and every product looks like it collapsed. Nothing collapsed; you compared eight days with thirty.
Ignoring seasonality. Comparing December with January will tell you sales fell off a cliff at almost any store. Comparing this December with last December tells you something real. When seasonality is in play, the same period last year is nearly always the fairer comparison.
Getting the timeframe right also decides whether a report keeps working. A rolling period stays current on its own, so a dashboard you check weekly never needs touching. A fixed range stays frozen, which is what you want for a month-end report that has to keep matching the number you already reported.
Mixtable uses the same five timeframe types for analytics columns and Pivot Table worksheet metric columns. Time Series worksheets use time-period columns, which are explained separately below.
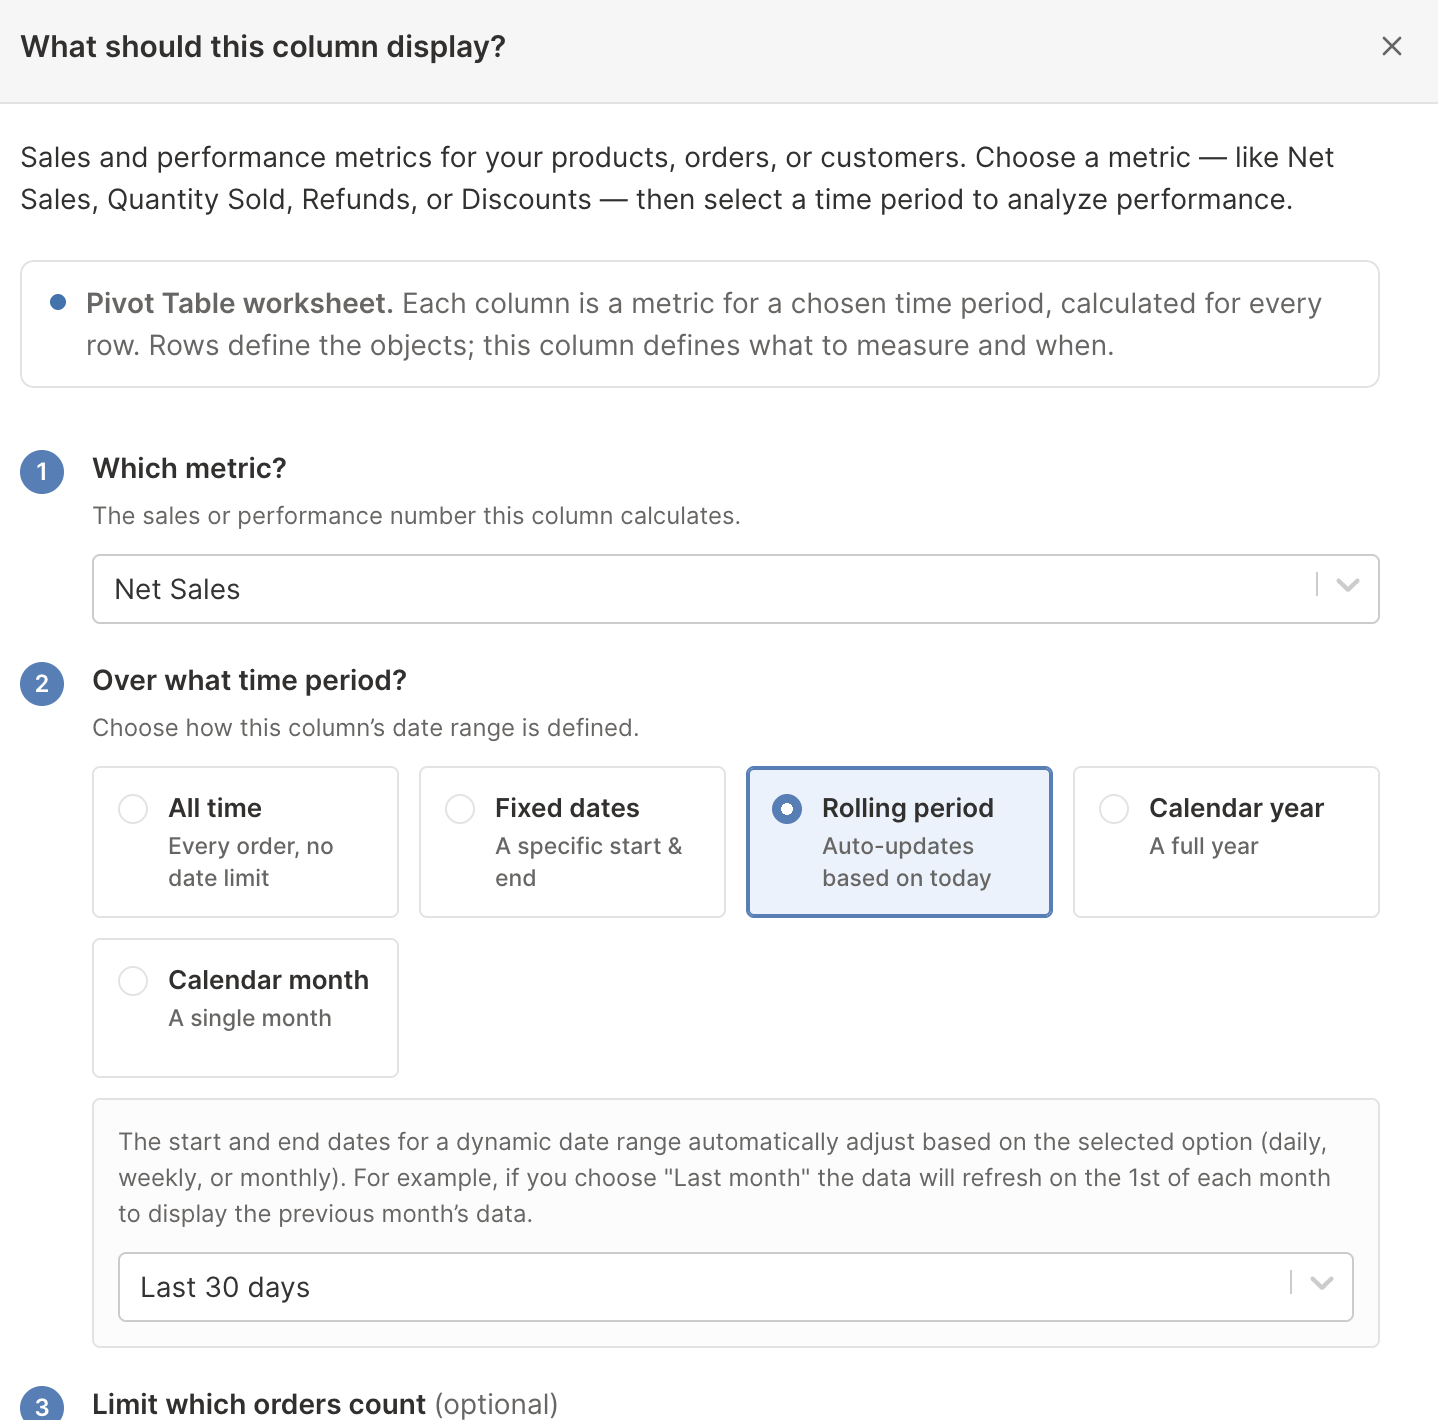
All time
All time includes the full Shopify order history available to Mixtable analytics.
Use it for:
- Lifetime product, variant, customer, or collection rankings
- Long-term customer purchase value
- Overall vendor or product-category contribution
- A baseline beside a shorter recent period
All time is useful for context, but it can hide a recent decline. Add the same metric with a recent rolling or calendar timeframe when current momentum matters.
Fixed dates
Fixed dates keeps the selected start and end dates unchanged. The end date shown in the interface is included in the calculation.
Use fixed dates for:
- A promotion or advertising campaign
- Black Friday and Cyber Monday
- A product launch
- A trade show or retail event
- Comparing identical date ranges across years
Mixtable offers shortcuts such as Today, Yesterday, Past week, Past month, Past 3 months, Past 6 months, Past year, Past 2 years, and the store’s available Shopify history. You can also select custom dates.
Fixed dates are best when the historical boundaries must never move.
Rolling period
Rolling period moves automatically based on today. Available rolling choices include:
- Today
- Yesterday
- Current week, Sunday through today
- Last week, Sunday through Saturday
- Current month
- Last month
- Last 30 days
- Last 60 days
- Last 6 months
Use a rolling period for a report that should stay current without editing its date settings. For example, a Last 30 days Net Sales column always describes the most recent rolling window.
Rolling periods that sound similar
- Last month means the previous complete calendar month
- Current month means the current calendar month through today
- Last 30 days means a moving 30-day window ending today
- Past month is a shortcut in Fixed dates, based on the dates selected when the column is configured
Choose a complete calendar period for accounting-style comparisons. Choose a rolling window for operational monitoring.
Calendar year
Calendar year uses January 1 through December 31 of the selected year.
Use it for:
- Year-over-year sales comparisons
- Annual vendor or collection reviews
- Annual refund and discount analysis
- Adding this-year and last-year columns to the same worksheet
A current-year column includes the year through the latest available data. When comparing it with a completed prior year, remember that the periods are not equal until the current year ends. For a like-for-like comparison during the year, use matching fixed date ranges.
Calendar month
Calendar month uses the first through the final day of the selected month.
Use it for:
- Month-over-month sales comparisons
- Promotion analysis tied to a complete month
- Monthly vendor, Market, or segment reporting
- Comparing the same month across years
Calendar month is different from Last 30 days. February, March, and April contain different numbers of days, while a rolling 30-day period always follows its moving boundary.
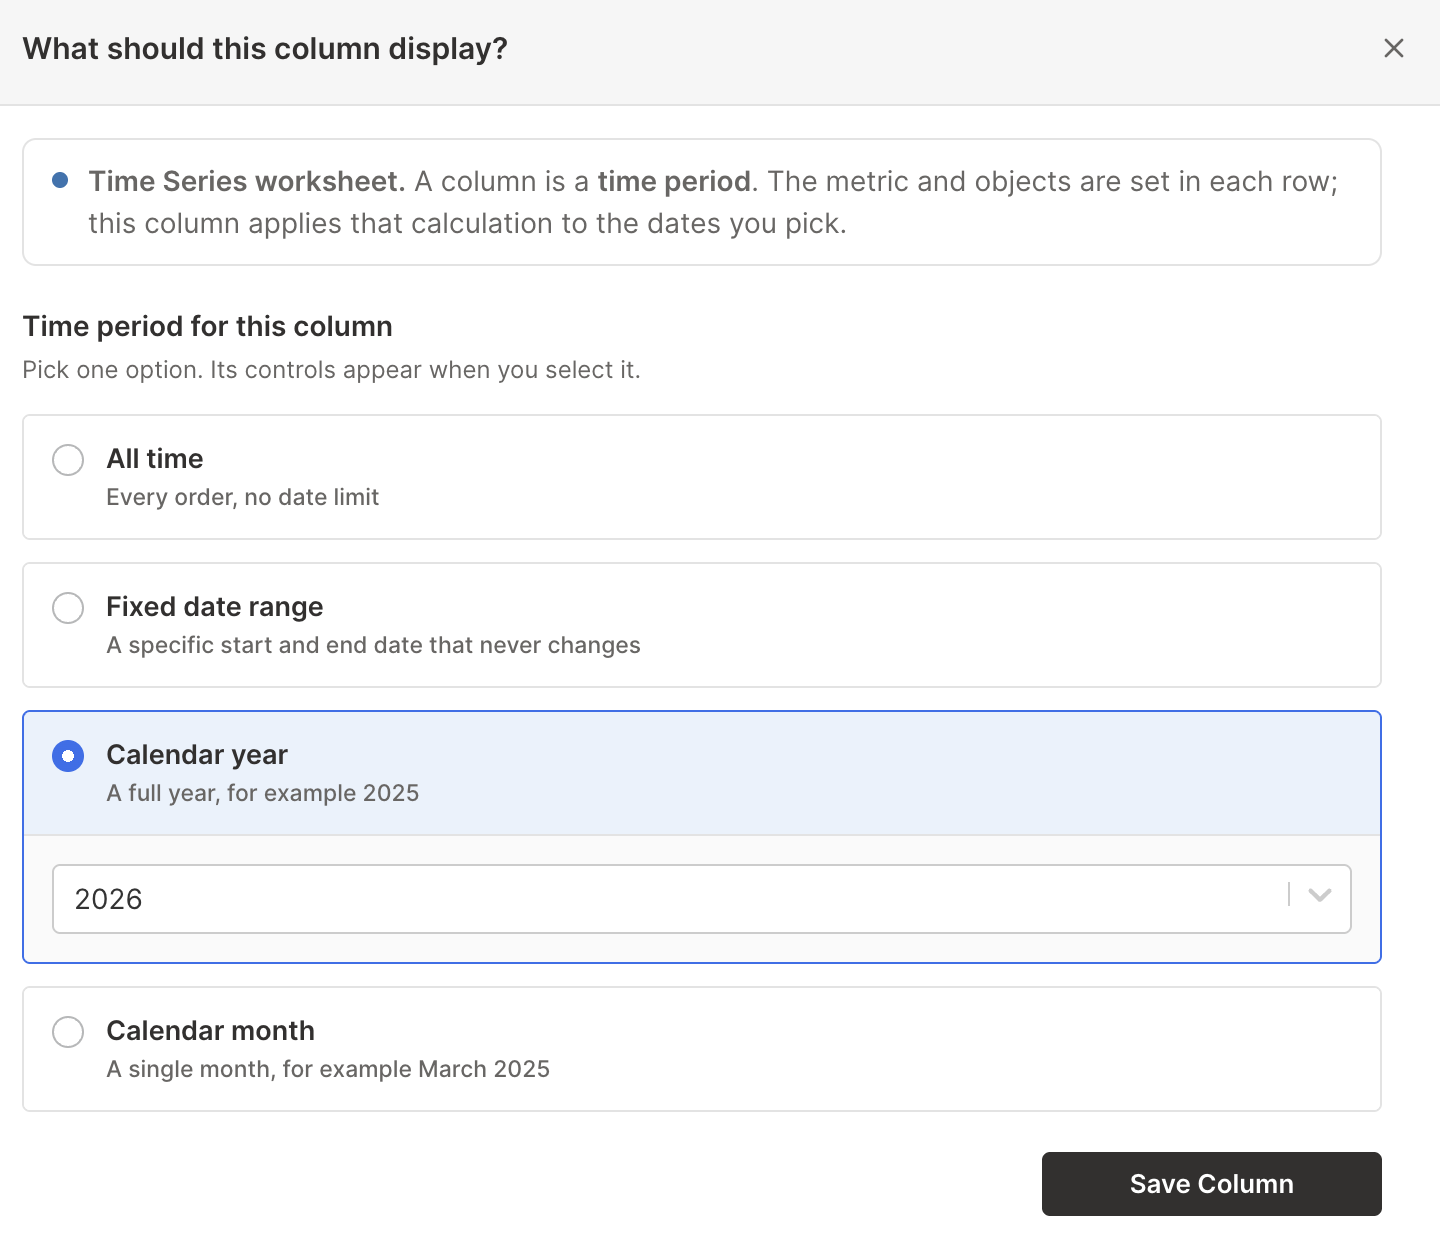
Time Series monthly and yearly columns
A Time Series worksheet stores the metric and Shopify object group in each row. Each analytics column supplies the dates for that row’s calculation.
The builder can create:
- Between 1 and 36 recent monthly columns
- Between 1 and 10 recent yearly columns
Choose By month for detailed seasonality and recent movement. Choose By year for longer-term direction and a more compact worksheet.
You can add another time-period column after creation by selecting an empty column, clicking the  button, choosing the dates, and saving the column. A Time Series column offers All time, a fixed date range, a calendar year, or a calendar month, because the metric itself is stored in the row.
Build fair comparisons
For a reliable Shopify analytics comparison:
- Keep the metric the same
- Keep the order filters the same
- Use periods with comparable lengths and seasonal context
- Label the columns clearly
- Add a formula for the absolute or percentage difference
For example, compare September 1 through December 31 this year with the same dates last year, rather than comparing an incomplete holiday season with a completed one.
Name date-based columns clearly
Useful names include:
Net Sales · All timeNet Sales · Last 30 daysOrders Count · 2026Refund Amount · 2026 MarchNet Sales · BFCM 2025
When a filter also matters, add it to the name, such as Net Sales · 2026 · B2B.
Next, see how to filter Shopify analytics reports without changing the timeframe.
Manage Shopify data in a spreadsheet.
Use Mixtable to edit, sync, analyze, import, and export your Shopify store data without CSV juggling.