
Find your way around the Mixtable spreadsheet
 All Mixtable apps
Updated October 8, 2026
All Mixtable apps
Updated October 8, 2026 On this page
Every Mixtable spreadsheet has the same layout: a menu bar across the top, a toolbar under it, and the grid of cells with its column letters, row numbers, and worksheet tabs. This guide shows where each tool lives, so you can edit, format, and sync your Shopify data without hunting for anything.
Used Mixtable before October 2026? Jump to Where did it go? to find the tools that moved.
The screen at a glance
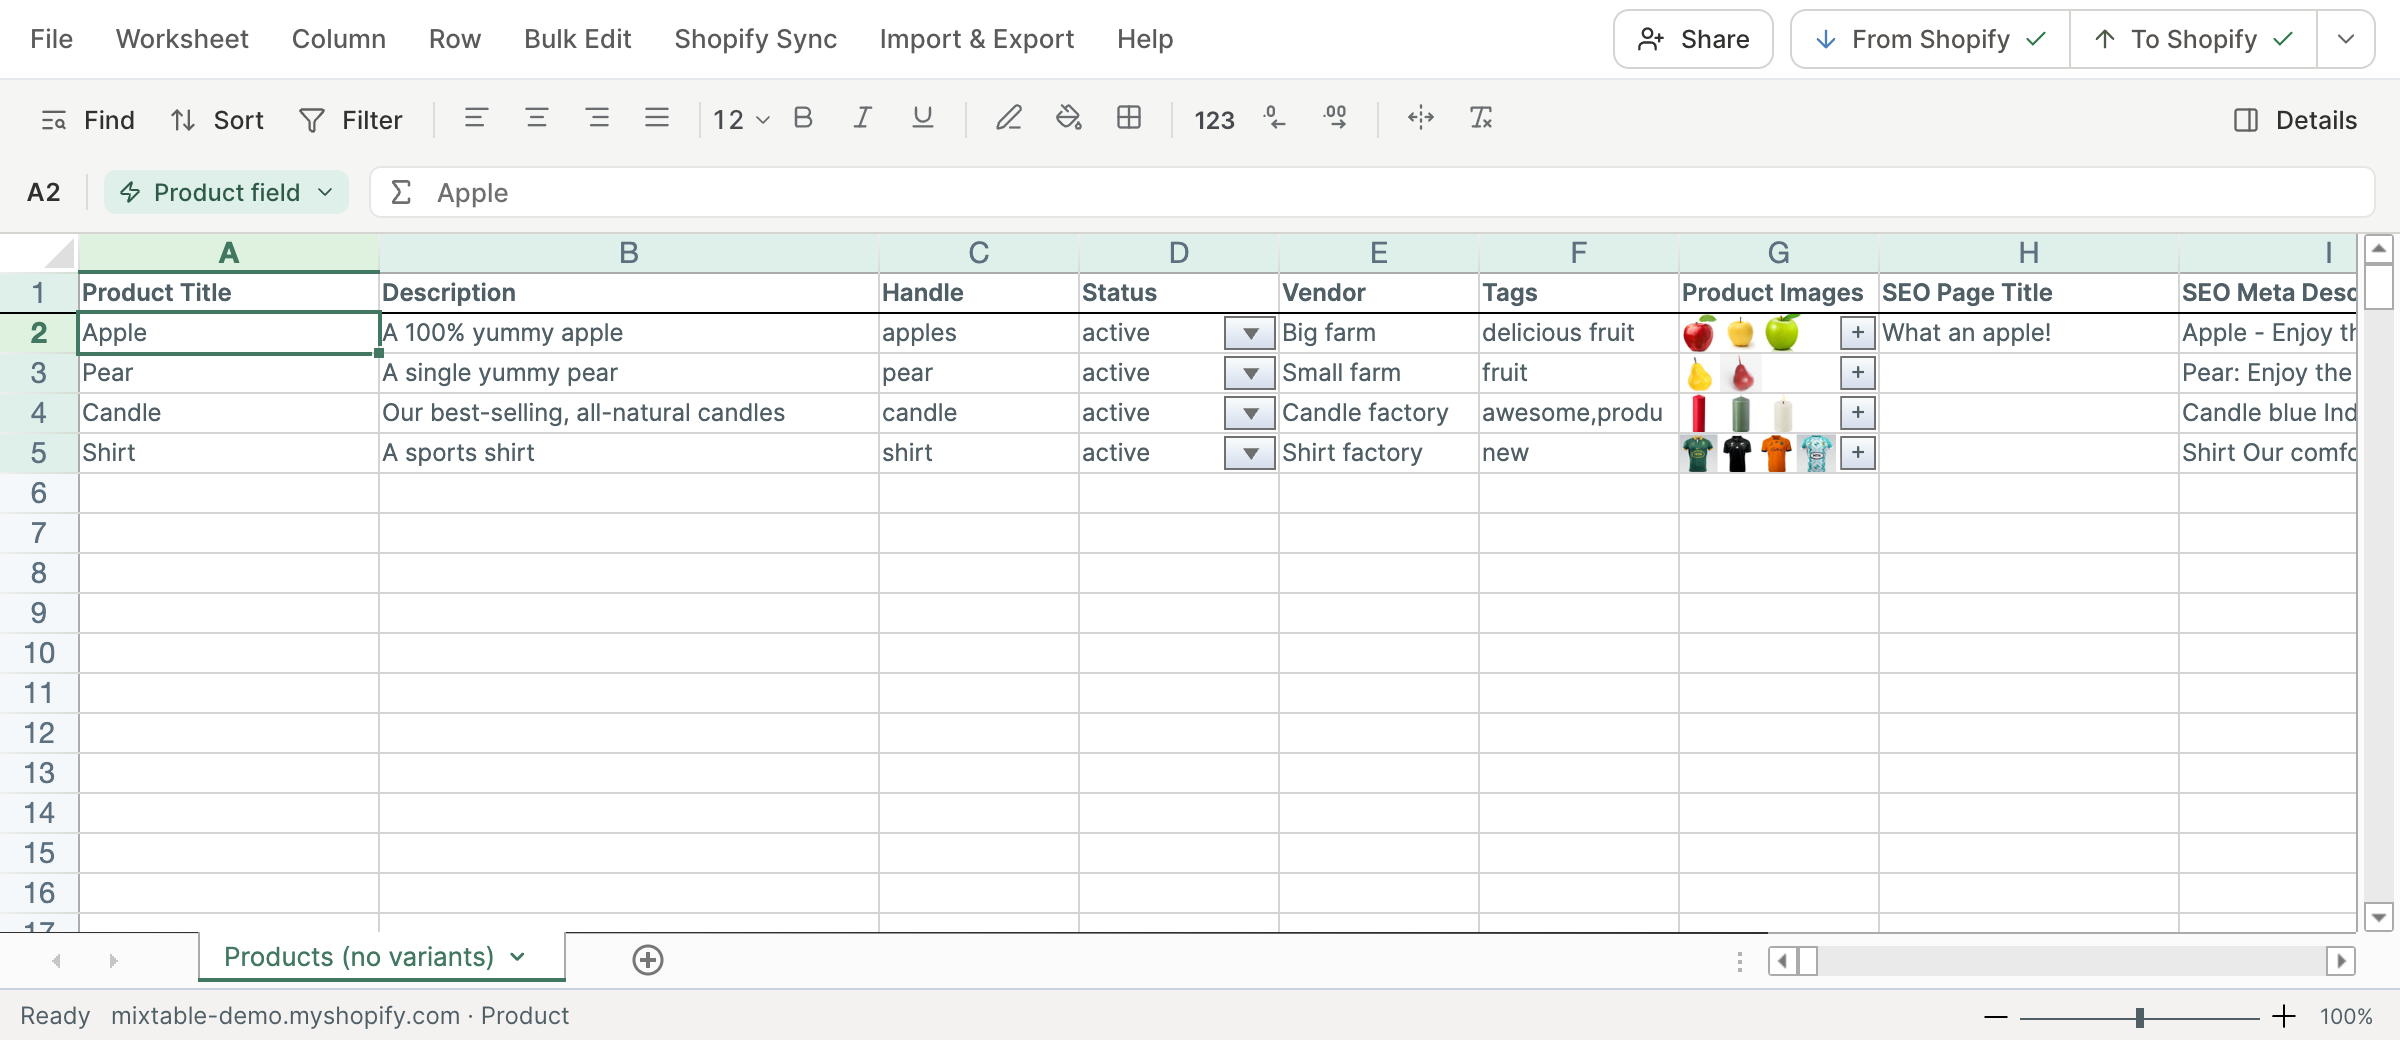
- Menu bar: the top row, with the File, Worksheet, Column, Row, Bulk Edit, Shopify Sync, Import & Export, and Help menus. Share and the sync control sit at its right end
- Toolbar: the gray band under the menus, with the cell address, the column chip, the formula box, Find, Sort, Filter, the formatting buttons, and Details
- Grid: your worksheet’s cells. Right-click a column letter, a row number, or a worksheet tab to open a menu for it
On a narrow screen, such as a phone, Mixtable shows a simpler view of the spreadsheet without these menus.
The menu bar
Each menu is named for what it acts on, and every entry has a short description under its name, so you can browse a menu to see what it does. Entries that don’t apply at the moment are grayed out. For example, only the spreadsheet’s owner can rename or delete the spreadsheet, add or delete worksheets, or delete items in Shopify.
- File: Rename Spreadsheet, Print… (see Print a worksheet), Delete Spreadsheet, and Exit Spreadsheet, which takes you back to your dashboard
- Worksheet: Add worksheet…, Rename worksheet…, Delete worksheet…, Find in worksheet, Sort Worksheet, switches for Filter, Lock top row, and Lock left-most column, and Remove Empty Rows. On a conditional worksheet, Change which rows appear… edits the conditions that decide which Shopify items it shows
- Column: Add Shopify data…, Type & format…, Number format, Conditional formatting…, Autofit column width, Sort worksheet by column C… (named for the selected column), Insert column to the left, and Remove column
- Row: Open in Details, Row history, Cell history, Autofit row height, Insert row above, and Remove row from sheet. Shopify data worksheets also have Delete product in Shopify…, where the word matches the worksheet’s items, such as product variant, customer, or order. Pivot Table and Time Series worksheets have Choose what to analyze… instead
- Bulk Edit: Bulk number changes, Find and Replace, Add tags, and Remove tags, each with a Learn more link
- Shopify Sync: Sync with Shopify…, Re-download store data…, and Fill Missing Worksheet Data
- Import & Export: Export to Excel for the whole spreadsheet, Export to CSV for the worksheet you’re on, and Import CSV file
- Help: Keyboard shortcuts, a few popular help articles, All Help articles, and Contact support, which opens a form for messaging the Mixtable team
The Column and Row menus act on the columns and rows you’ve selected. A heading at the top of each says which, for example Column C or Rows 4–6, and whether they’re linked to Shopify.
Share and the sync control
At the right end of the menu bar, Share lets the spreadsheet’s owner invite people who already have a Mixtable account (see Share Spreadsheet With Shopify Data). Next to it, the sync control is where your edits go to Shopify and where updates from Shopify come in. When there’s something to do, it shows buttons such as Sync 12 changes, Preview, or Apply 3 updates, and its ▾ opens the sync card with more detail. Sync Shopify data with Mixtable explains how it works.
Menus on column letters, row numbers, and tabs
Right-click a column letter, a row number, or a worksheet tab to open the menu for that column, row, or worksheet. Right-clicking another worksheet’s tab switches to that worksheet first. The tab of the worksheet you’re on also has a small ▾ that opens its menu.
You can reach these options in other ways too. All column options in the column chip opens the same column menu, and the Column and Row menus in the menu bar have most of the same options. Right-clicking a cell opens a shorter menu for the cell, which includes View cell history. Press Esc to close any menu.
Column menu
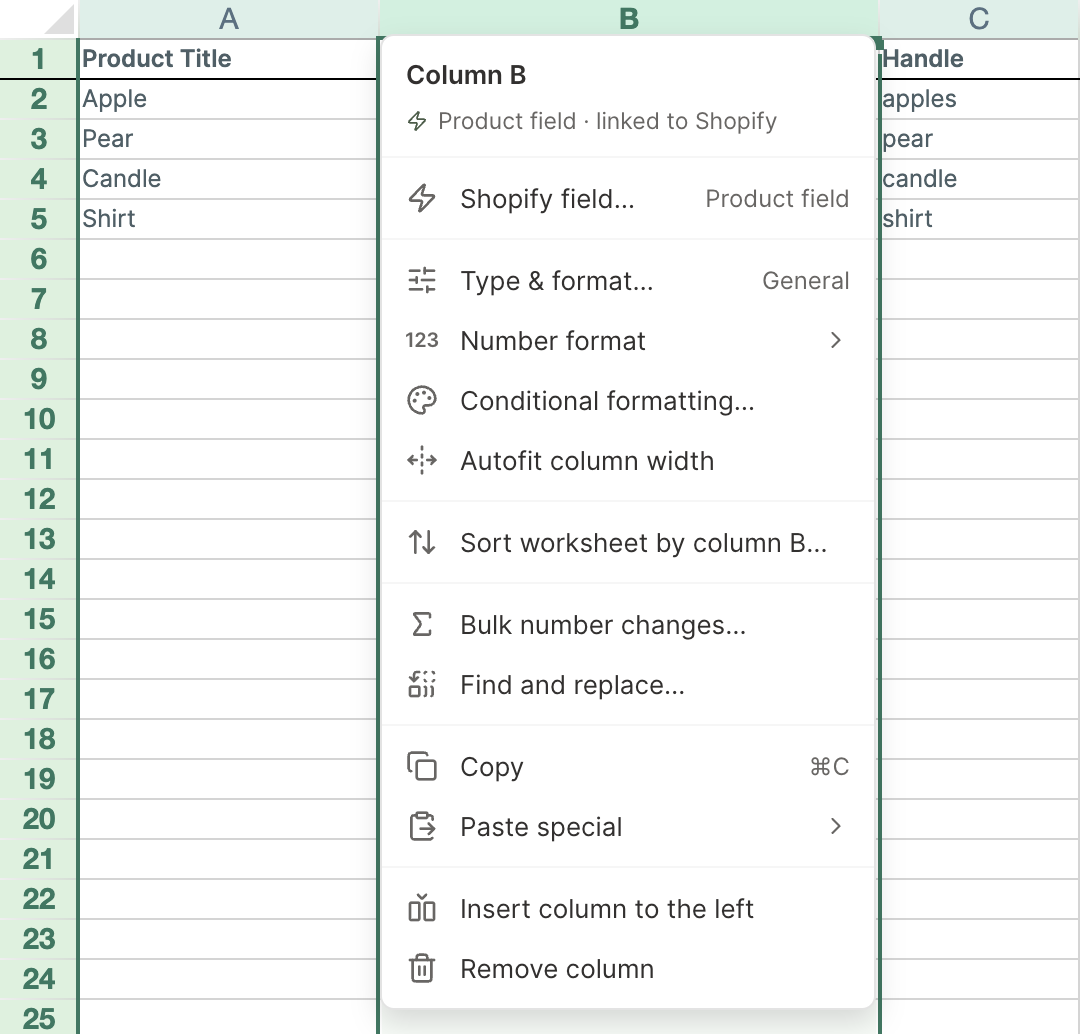
- Shopify field…: on a column linked to Shopify, shows what the column is mapped to, such as a product field or a metafield. The mapping can’t be changed here, so to show a different field, add it in a new column. On an empty column, it opens the field picker to link that column. On a Pivot Table worksheet, this option reads Choose metric & time period…, and on a Time Series worksheet it reads Choose time period…, because a report column is a metric over a period rather than a Shopify field
- Type & format…: makes the column currency, a date, a percent, a dropdown list, and more (see Format columns in Mixtable)
- Number format: quick formats such as Number, Percent, currencies, and dates
- Conditional formatting…: colors cells automatically based on their values (see Conditional formatting)
- Autofit column width: fits the column to its longest value
- Sort worksheet by column C…: opens Sort Worksheet with this column already chosen
- Bulk number changes… and Find and replace…: open those Bulk Edit tools with this column already chosen
- Copy and Paste special, which can paste Everything, Formulas only, Values only, Formatting only, Values and formatting, or Formulas and formatting
- Insert column to the left and Remove column. Removing a column takes it out of this worksheet only, and your Shopify data doesn’t change
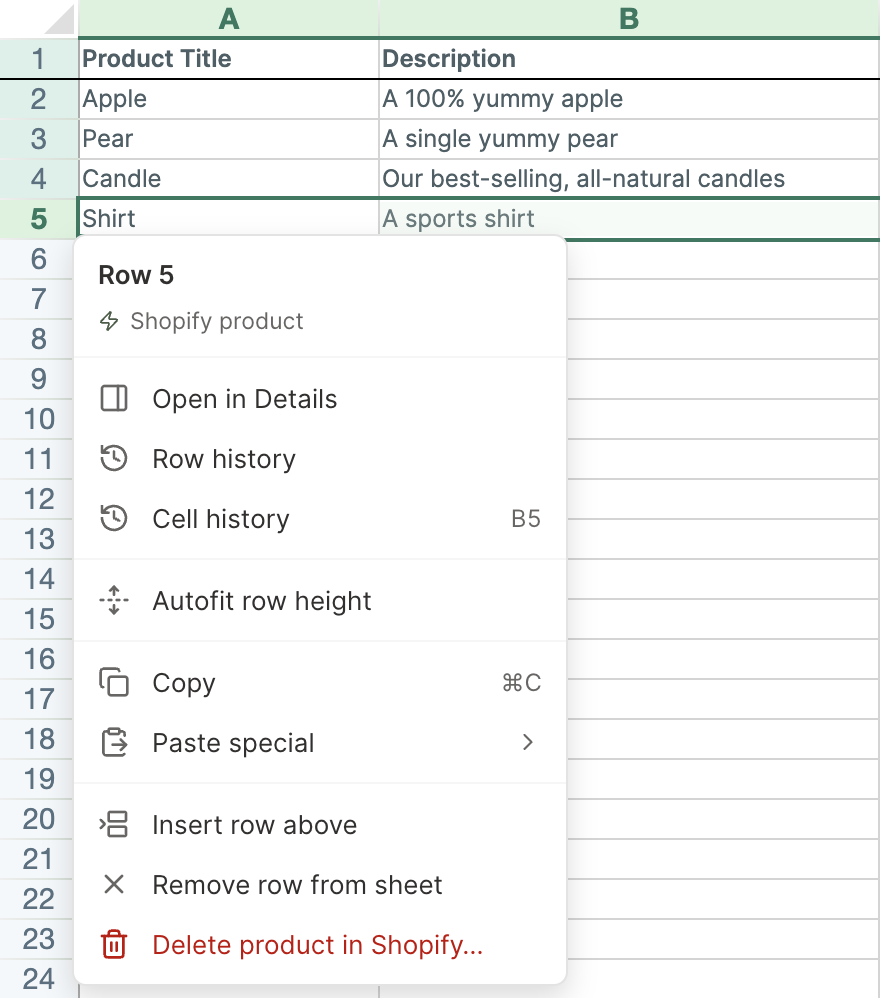
Row menu
- Choose what to analyze…: on Pivot Table and Time Series worksheets, this comes first in the menu. It picks the Shopify data an empty report row analyzes, such as all your products or one vendor’s, in the Analytics Row Settings window. On a Time Series worksheet, you also pick the row’s metric there
- Open in Details: shows the row’s whole Shopify record, including fields that aren’t columns in this worksheet. It’s view only (see the Details panel)
- Row history and Cell history: the latest changes to the row’s Shopify fields, or to one cell’s. Cell history opens the cell in this row and the column you had selected, and the menu shows its address beside the entry, such as G3 (see Cell history and Row history)
- Autofit row height: makes the row tall enough to show its wrapped text
- Copy and Paste special
- Insert row above
- Remove row from sheet: takes the row out of this worksheet only, and your Shopify data doesn’t change. The header row can’t be removed
- Delete product in Shopify…: permanently deletes the row’s item from your Shopify store after you confirm. Only the spreadsheet’s owner can use it, and only on rows linked to Shopify. Mixtable doesn’t remove the row: once Shopify has deleted the item, Mixtable clears the row and leaves it empty, and Worksheet > Remove Empty Rows tidies up (see Delete a product from your Shopify store)
Worksheet tab menu
- Rename worksheet…, Add worksheet…, and Delete worksheet…. Deleting a worksheet removes it and its data from the spreadsheet, and your Shopify store’s data doesn’t change
- Change which rows appear…, on a conditional worksheet
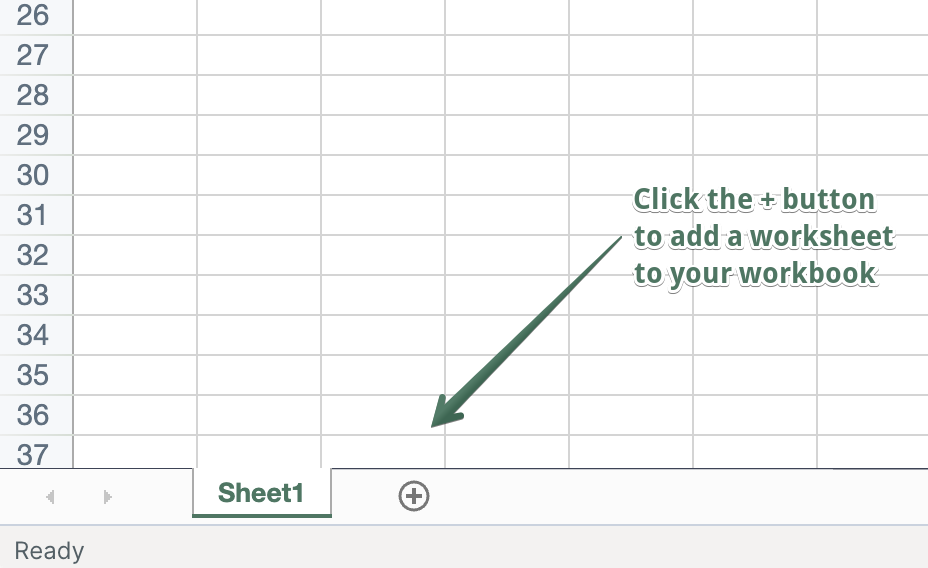
You can also double-click a tab to rename it, and click the + at the end of the tabs to add a worksheet.
Work on several rows or columns at once
Right-clicking a row number or column letter selects that row or column, so its menu acts on that one. If you’ve already selected several whole rows or columns, right-clicking one of them keeps them all selected. To act on several:
- Select the rows or columns. For example, click the first row number and drag across the others, or click the first one and Shift-click the last
- Right-click one of the selected row numbers or column letters, or open the Row or Column menu in the menu bar
- Choose the option. It shows how many rows or columns it covers, for example Remove 3 rows from sheet, Insert 2 columns to the left, or Delete 3 products in Shopify…
If a filter is on, the row options leave the rows it hides alone.
Add Shopify data to a column
On Shopify data worksheets and Reporting worksheets, empty columns show a + Shopify data button in their header row cell (on Pivot Table and Time Series worksheets, it reads + Analytics data). You’ll find it in any empty column between your columns and in the first five empty columns after your last one. It’s the quickest way to show another field from your Shopify store, right where you want it.
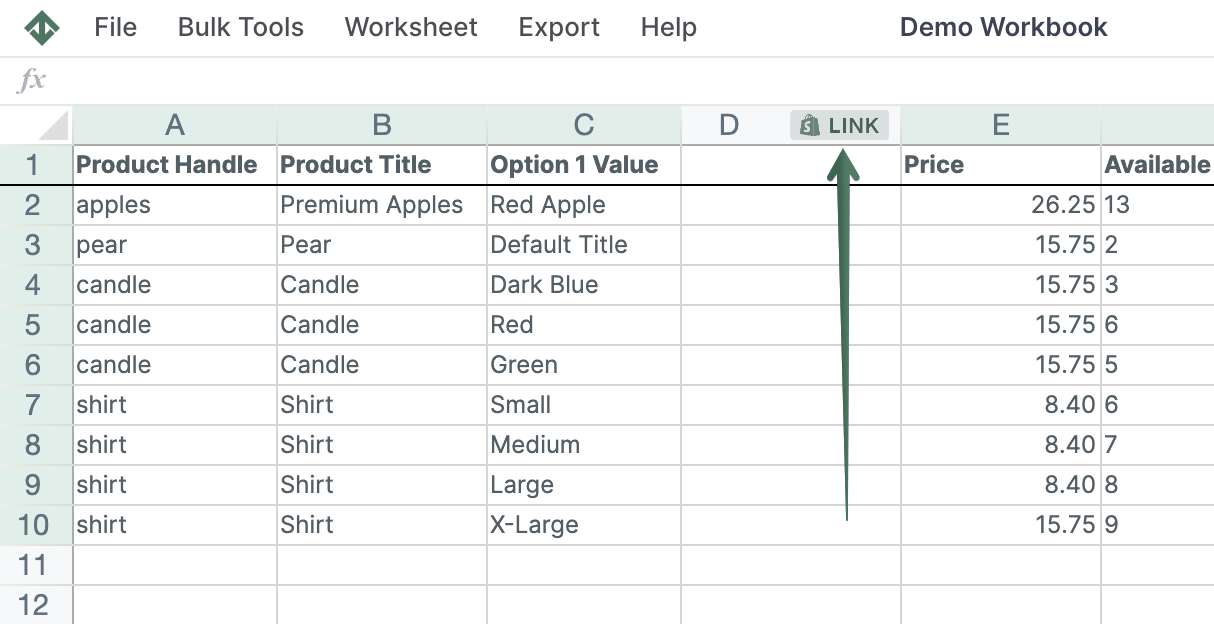
- Click + Shopify data in the header row of the empty column you want to fill. You can also choose Column > Add Shopify data… from the menu bar, which fills the first empty column after your last one
- The field picker opens and asks What should column E show?, with your column’s letter in place of E. Type in the search box at the top, or click a section on the left. The sections follow the record’s page in your Shopify admin, such as Pricing, Inventory, Custom data (your metafields), and Sales & analytics. The search understands everyday words too, so “stock” finds inventory and “UPC” finds barcodes
- Click the field you want. The panel on the right explains what it holds, asks any choice that’s left (such as which stock count to show), and shows an example from your worksheet. In the list, gray sample values come from one of your rows, and a tag such as ”✓ B” means column B already shows that field
- Click Save Column
Mixtable then fills the column with data from your store.
An analytics metric or a translation language opens its own settings in place of the list, with that metric or language already chosen. Click All fields at the top to go back. On Pivot Table worksheets, + Analytics data opens the analytics settings right away, and on Time Series worksheets it opens the time period settings.
To put the new column somewhere specific, such as between two columns you already have, right-click the letter of the column it should go before and choose Insert column to the left. The new empty column gets its own + Shopify data button.
The button only shows in columns that aren’t linked to Shopify and have nothing in their header row cell. If you type a name into a column’s header row cell, its button goes away, and it comes back if you clear the name.
Basic worksheets don’t hold Shopify data, so they don’t have the button.
The toolbar
The toolbar sits under the menu bar. From left to right, it has:
- Cell address: the cell you’ve selected, such as C4
- Column chip: says what the selected column shows (see the next section)
- Formula box: shows the selected cell’s value or formula, and lets you edit it
- Find: searches this worksheet’s cells for a word or number, the same as pressing ⌘F (Ctrl+F on Windows). It isn’t Find and Replace, which is in the Bulk Edit menu (see Find Shopify information)
- Sort: opens Sort Worksheet to put the worksheet’s rows in order (see Sorting Shopify store data)
- Filter: shows filter buttons on the header row (see Filter Shopify data)
- Formatting buttons: Align Left, Align Center, Align Right, Justify, Font Size (8 to 24), Bold, Italic, Underline, Font Color, Fill Color, Borders, Number Format (the 123 button, whose More formats… opens Type & format), Decrease Decimal Places, Increase Decimal Places, Autofit, and Clear Formatting. Point at a button to see its name (see Format columns in Mixtable)

- Details: at the far right, opens the selected row’s Shopify record in a side panel. It’s view only, so to change a value, edit the cell and sync
In a narrower window, the buttons get a row of their own above the formula box.

What the column chip tells you
On a Shopify data worksheet, columns linked to Shopify have green column letters, and the column chip next to the cell address names what the selected column shows. For example, it might say “Product field · linked to Shopify”, “Metafield · linked to Shopify”, or “Analytics metric · linked to Shopify”. A column you type into yourself says “Not linked to Shopify”. On Reporting worksheets, whose linked column letters are blue, the chip appears only on linked columns.
Click the chip to see the column’s details:
- What the column shows and what kind of column it is. Translation columns are marked Beta, and a metafield column lists its namespace, key, and type
- The column’s format, with Change…, which opens Type & format
- How the column syncs: “Your edits go to Shopify when you sync them”, or for read-only columns such as analytics and related data fields, “These values come from your Shopify data, so edits here don’t sync”
- For translations and market prices, which Shopify doesn’t send on its own, a Download latest button that opens the sync card
- All column options, which opens the column menu
For a column that isn’t linked to Shopify, the details offer + Shopify data to link that column.
When a worksheet is locked
Sometimes Mixtable needs a moment to work on a worksheet, for example while it loads your Shopify data into a new worksheet. While it works, an amber bar with a lock takes the place of the formula box and the toolbar buttons, and says why:
| The bar says | What’s going on |
|---|---|
| This worksheet is locked while your Shopify data loads. | Mixtable is filling the worksheet with data from your store, for example right after you add it |
| This worksheet is locked while it’s sorted. | Mixtable is putting the rows in the order you chose |
| This worksheet is locked while its rows are updated. | Rows are being added, removed, or filled in, for example after you remove rows |
| This worksheet is locked while its columns are updated. | Columns are being added, removed, or filled in, for example after you add a column of Shopify data |
| This worksheet is locked while your changes sync to Shopify. | Mixtable is sending your edits to Shopify |
| This worksheet is locked while Mixtable refreshes it. | Mixtable is reorganizing the worksheet’s data behind the scenes |
| This worksheet is locked while Mixtable updates it. | Mixtable is doing other work on the worksheet |
The bar then adds: “You can still browse the data, but you can’t make changes until it’s done.” You can keep scrolling and reading in the meantime, though options that change the worksheet, such as Insert row above, are unavailable. The bar goes away by itself when the work is done.
Keyboard shortcuts
Choose Help > Keyboard shortcuts to see these at any time in the app.
| Action | Mac | Windows |
|---|---|---|
| Find in this worksheet | ⌘F | Ctrl+F |
| Export to Excel | ⌘S | Ctrl+S |
| ⌘P | Ctrl+P | |
| Copy | ⌘C | Ctrl+C |
| Paste | ⌘V | Ctrl+V |
| Bold | ⌘B | Ctrl+B |
| Italic | ⌘I | Ctrl+I |
| Underline | ⌘U | Ctrl+U |
| Rename a worksheet | Double-click its tab | Double-click its tab |
Where did it go?
If you used Mixtable before October 2026, here’s where the tools you know are now.
| Before | Now |
|---|---|
| Lightning bolt button on an empty column letter (green, or blue on Reporting worksheets), for adding Shopify data | + Shopify data in the header row of an empty column (+ Analytics data on Pivot Table and Time Series worksheets), or Column > Add Shopify data… |
| The column settings window, with categories such as Shopify data fields and Metafields | The field picker, What should column E show?, with a search box and sections modeled on your Shopify admin |
| Reload buttons in column settings, such as Reload definitions or Reload Locations | Refresh in a field picker section’s heading, such as Custom data or Inventory |
| Lightning bolt on an empty row number of a Pivot Table or Time Series worksheet | Right-click the row number > Choose what to analyze…, or Row > Choose what to analyze… |
| Right-click a column letter > Shopify Sync Settings | Right-click the column letter > Shopify field… (Choose metric & time period… on Pivot Table worksheets, Choose time period… on Time Series worksheets) |
| Right-click a column letter > Format Column | Right-click the column letter > Type & format…, or Column > Type & format… |
| Right-click > Insert | Insert row above in the row menu, or Insert column to the left in the column menu |
| Right-click a column letter > Remove Column | Right-click the column letter > Remove column, or Column > Remove column |
| Right-click a row > Remove Row | Right-click the row number > Remove row from sheet, or Row > Remove row from sheet |
| Right-click a row > Delete object in Shopify | Right-click the row number > Delete product in Shopify… (named for the worksheet’s items), or the same option in the Row menu |
| Right-click > View row history | Right-click the row number > Row history, or Row > Row history |
| Right-click a cell > View cell history | Still there, and also right-click the row number > Cell history, or Row > Cell history |
| Bulk Tools menu | Bulk Edit menu, with the same four tools. The column menu also has Bulk number changes… and Find and replace… for that column |
| Shopify Sync > Sync from Shopify | Shopify Sync > Re-download store data… |
| Sidebar button | Details button at the right end of the toolbar, or Row > Open in Details. It’s view only now |
| Shopify sync card at the bottom right of the spreadsheet | The sync control at the top right, next to Share. Its ▾ opens the sync card |
| Change Conditional Worksheet criteria button | Worksheet > Change which rows appear…, or the ▾ on the worksheet’s tab |
| ”Worksheet is temporarily locked. Please wait a moment.” | An amber bar that says why the worksheet is locked (see When a worksheet is locked) |
| ⌘F or Ctrl+F only | Also the Find button in the toolbar, and Worksheet > Find in worksheet |