


Shopify B2B Sales Analytics
Shopify B2B Sales Analytics
Mixtable can calculate Shopify B2B sales and order metrics for each Company or Company Location row. This lets you compare wholesale accounts while keeping company names, location details, payment terms, contacts, and other Shopify B2B fields beside the results.
Why wholesale needs its own reporting
When B2B and retail run through one Shopify store, the totals blur together, and the two sides of the business behave nothing alike. Wholesale means fewer orders, much larger baskets, negotiated pricing, payment terms, and a handful of accounts carrying a large share of revenue. Averaged in with retail, none of that is visible.
Reporting by Company and Company Location tells you:
- Which accounts actually carry your wholesale revenue, and how concentrated that risk is
- Which accounts have gone quiet, which is far easier to miss with 40 accounts than with 40,000 shoppers
- How much each account really contributes once discounts and refunds are counted
- Which locations of a multi-site customer order well and which never got going
- Whether the terms and pricing you negotiated are producing the volume they assumed
Concentration is the one to watch. If your top three accounts are most of your wholesale business, that is a fact worth knowing before you lose one, and it only shows up when accounts are ranked side by side.
Use a Company worksheet for account-level reporting. Use a Company Location worksheet when one company has several buying or delivery locations that need separate analysis.
B2B analytics metrics
Supported Company and Company Location analytics include:
- Net Sales
- Gross Sales
- Total Sales
- Net Quantity Sold
- Gross Quantity Sold
- Refunded Quantity
- Order Count
- Total Refund Amount Excluding Tax
- Total Refund Amount Including Tax where available
- Total Discount Amount
- Total Tax Amount
- Total Duties
- Total Additional Fees
- Total Shipping Amount
- Refund Count
- Percent of Orders Refunded
- Average Order Value
- Average Order Quantity Net
- Average Order Quantity Gross
Add analytics to a Company worksheet
-
Open a Shopify Companies or Company Locations worksheet, then select an empty column or insert a new one. Empty columns have a non-green header; a green header means the column is already linked to Shopify data
-
Click the
 button in the column header
 -
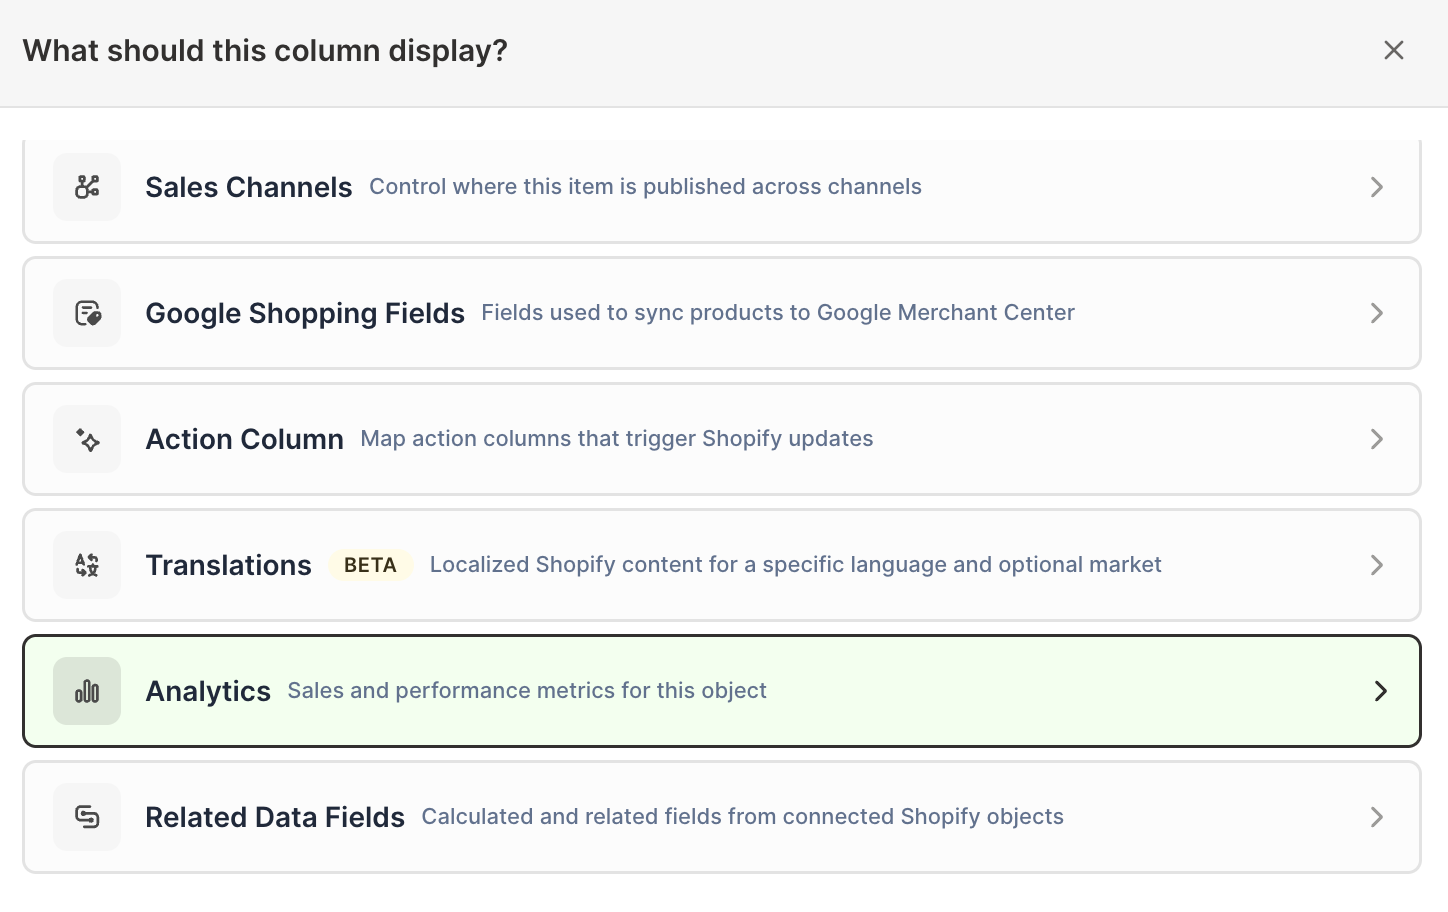
Choose Analytics
-
Under Which metric?, select the B2B metric you want
-
Under Over what time period?, choose All time, Fixed dates, Rolling period, Calendar year, or Calendar month
-
Under Limit which orders count, add any optional filters supported by the metric
-
Click Save Column
The metric calculates separately for every company or location row.
Compare B2B and B2C order activity
The Order type filter separates B2B and B2C Shopify orders where that filter is supported.
To compare them on another supported worksheet:
- Add Net Sales with the required timeframe
- Under Limit which orders count, add Order type and choose B2B
- Add Net Sales again with the same timeframe
- Set the second Order type filter to B2C
- Name both columns clearly
Add Orders Count and Average Order Value the same way. B2B can have fewer orders but much larger baskets, so order count alone can be misleading.
Filter one B2B company or location
Company and Company Location filters depend on the order type:
- Add Order type and select B2B
- Add Company or Company location
- Select the Shopify B2B account or location
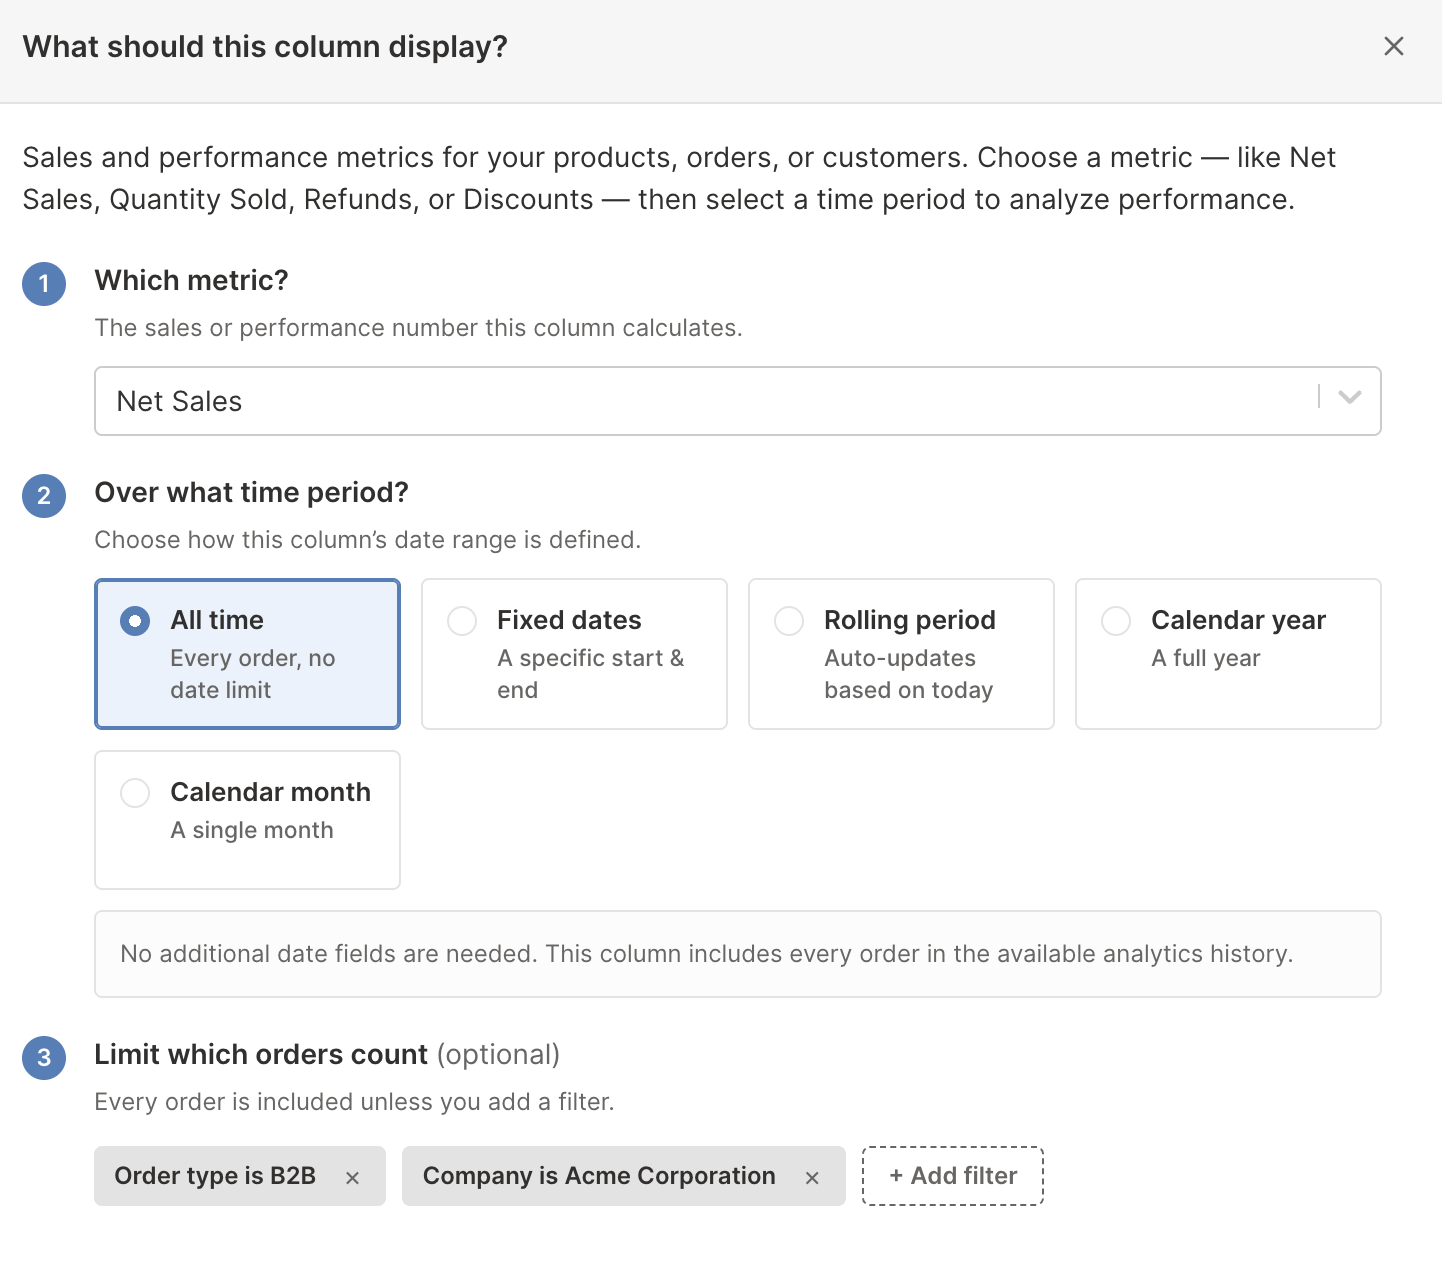
Both filters stay listed under Limit which orders count, so you can see the full narrowing at a glance before saving the column.
Use this when the worksheet rows represent another object, such as products or variants, and you want to see what one B2B customer bought.
For example, add Net Quantity Sold filtered to one Company on a Product Variants worksheet to create a reorder-planning view for that account.
Build a Company scorecard
Useful columns include:
- Net Sales for all time
- Net Sales for the last 12 months
- Order Count
- Average Order Value
- Net Quantity Sold
- Total Discount Amount
- Total Refund Amount Excluding Tax
- Percent of Orders Refunded
- Total Shipping, duties, tax, and additional fees
The lifetime and recent Net Sales columns help identify accounts that were historically important but have become inactive. Average Order Value and order quantities help distinguish frequent buyers from occasional large purchasers.
Compare companies and locations fairly
Before ranking B2B customers:
- Use the same timeframe in every column
- Keep order filters consistent
- Compare Companies with Companies and Locations with Locations
- Review refunds and discounts beside sales
- Include order count or quantity so one unusually large order does not define the account
- Consider payment terms and operational cost outside the analytics metrics
Net Sales is not account profitability. It does not subtract sales effort, payment risk, warehousing, custom service, or negotiated operational costs.
B2B analytics and Shopify B2B management
Analytics columns calculate performance. Company and Company Location worksheets also expose Shopify B2B fields for account management where supported.
See:
- Manage Shopify B2B companies
- Manage Shopify B2B company locations
- Bulk edit Shopify B2B price catalogs
Use the management articles for Shopify fields and syncing. Use this article for calculated order and sales performance.
Manage Shopify data in a spreadsheet.
Use Mixtable to edit, sync, analyze, import, and export your Shopify store data without CSV juggling.