


Shopify Profit, Gross Margin, and COGS Analytics
Shopify Profit, Gross Margin, and COGS Analytics
Gross Profit is sales minus the cost of the goods sold, % Gross Margin is that profit as a share of sales, and Amount of Cost of Goods Sold is the current variant cost multiplied by the quantity sold.
Revenue tells you what sold. Shopify profitability analytics adds the current product cost so you can compare Cost of Goods Sold, Gross Profit, Gross Margin, and Orders Net Profit across product variants and supported grouped reports.
These metrics are useful for merchandising and pricing, but they are not a complete business-profit calculation.
How Shopify profit, margin, and COGS are calculated
Amount of Cost of Goods Sold = Current variant cost × Quantity sold
Gross Profit = Sales - Amount of Cost of Goods Sold
% Gross Margin = Gross Profit ÷ Sales × 100
All three depend on Shopify’s Cost per item. Shopify does not keep the historical cost from the moment an order was placed, so Mixtable uses each variant’s current cost. That makes these estimates for merchandising and pricing rather than accounting figures, and variants with no cost set cannot contribute normally.
Why your bestseller list can be misleading
Sales rankings reward whatever moves the most money. That is not the same as whatever makes you the most money, and the two lists are often surprisingly different.
A discounted hero product can gross more than anything else in your catalog and contribute less than a quiet mid-table product with double the margin. Until you put cost beside sales, there is no way to tell them apart, so stock, ad spend, and homepage space keep flowing to whatever looks biggest.
Adding profitability metrics lets you:
- Rank products and variants by what they contribute, not by what they gross
- Decide which products deserve advertising budget and prime placement
- Spot items selling well at a margin too thin to be worth the handling
- Check whether a promotion left anything behind after the discount
- Compare vendors and categories on margin rather than revenue
Margin and profit answer different questions, so read them together. A 70% margin on something that sells twice a month matters less than a 25% margin on something that sells daily.
Before using profitability metrics
Shopify does not provide Mixtable with the historical Cost per item from the moment each order was placed. Mixtable uses the current cost stored on the product variant.
This means:
- Changing Cost per item can change the profitability interpretation of historical sales
- Variants without a cost cannot contribute normally to cost-based calculations
- The report does not preserve earlier supplier costs by order date
- The result is a current-cost estimate, not audited accounting profit
Complete and review your Shopify variant costs before relying on the ranking.
Profitability metrics
Cost of Goods Sold
Listed in the metric menu as Amount of Cost of Goods Sold. It multiplies the variant’s current Cost Per Item by the relevant sold quantity, estimating what the merchandise cost you.
Gross Profit
Subtracts current variant cost from the supported line-item sales basis for the relevant quantity. This is the money left after paying for the goods, before any of your other costs.
Gross Margin
Listed in the metric menu as % Gross Margin. It expresses Gross Profit as a percentage of the corresponding sales basis, which is what lets you compare a $12 product with a $400 one on equal terms.
Orders Net Profit
Calculates line-item net unit price minus current variant cost, multiplied by current quantity. It is available as an analytics column on Product Variant worksheets.
Customer Lifetime Value
Available as an analytics column on Customers worksheets. It subtracts the estimated cost of everything a customer bought from their Net Sales excluding tax, so it reports profit per customer rather than revenue. Because it depends on cost, it shows N/A for any customer who bought a variant with no cost recorded.
See Shopify Customer Analytics.
Start with Variant margin & inventory
The ready-made Variant margin & inventory report creates a Product Variants worksheet with:
- Product Title
- SKU
- Price
- Cost Per Item
- Total Inventory
- Amount of Cost of Goods Sold
- Gross Profit
- % Gross Margin
- Net Sales
- Net Quantity Sold
- Add an Reporting worksheet
- Under Shopify data worksheet with analytics columns, select Variant margin & inventory
- Click Continue
- Review the selected fields, analytics columns, and rows
- Click Create Worksheet
This is the best starting point because it keeps the current price, cost, and inventory beside the calculated metrics.
Add a profitability metric to a variant worksheet
-
Open a Product Variants worksheet, then select an empty column or insert a new one. Empty columns have a non-green header; a green header means the column is already linked to Shopify data
-
Click the
 button in the column header
 -
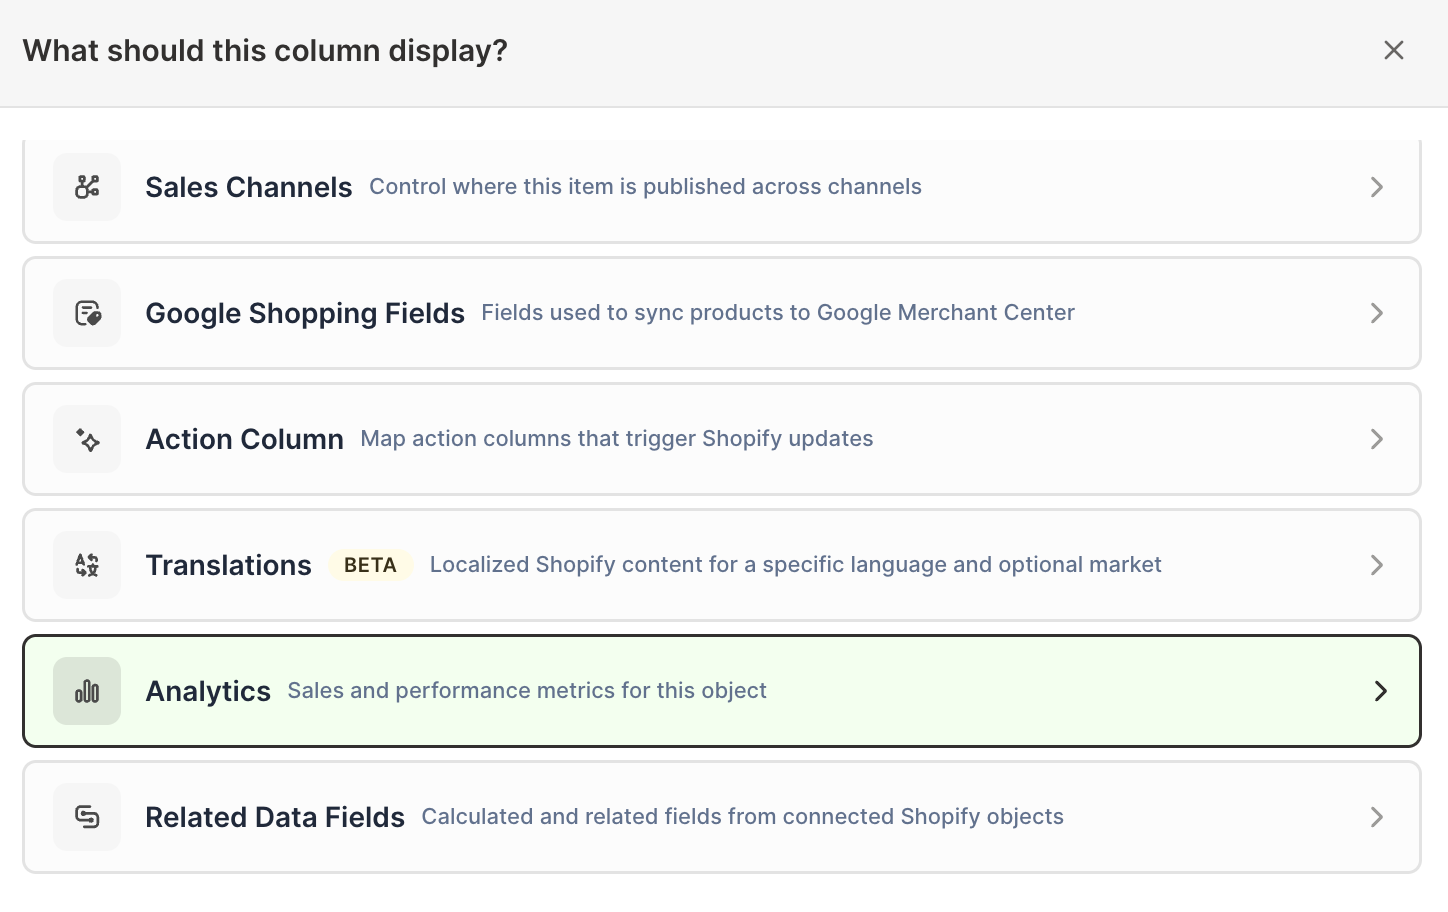
Choose Analytics
-
Under Which metric?, select Orders Net Profit, Gross Profit, % Gross Margin, or Amount of Cost of Goods Sold
-
Under Over what time period?, choose All time, Fixed dates, Rolling period, Calendar year, or Calendar month
-
Under Limit which orders count, add any optional filters supported by the metric
-
Click Save Column
Use the same timeframe and filters across all profit, cost, sales, and quantity columns.
Use profit metrics in a Pivot Table worksheet
The Pivot Table worksheet builder includes Gross Profit, % Gross Margin, and Amount of Cost of Goods Sold under Profit when supported. The builder labels the group as needing cost-per-item data.
This lets you compare profitability by vendor, product type, product category, product tag, collection, Market, or customer segment. Keep in mind that cost coverage can differ across groups.
If one vendor has complete costs and another does not, the ranking is not comparable until the missing Shopify costs are filled.
Profit is not the same as Net Sales
Net Sales removes discounts and returns from merchandise sales. It does not subtract product cost. A high-Net-Sales variant can still produce weak margin when its cost is high.
Place these together:
- Net Sales
- Cost of Goods Sold
- Gross Profit
- Gross Margin
- Net Quantity Sold
This separates scale from efficiency.
What these metrics do not subtract
Mixtable’s variant profitability metrics do not represent complete operating profit. They do not subtract every possible cost, such as:
- Advertising and agency spend
- Payment processing fees
- Warehousing and pick-and-pack cost
- Shipping subsidies
- Returns handling and customer support
- Platform subscriptions
- Payroll and overhead
Use the metrics for merchandise-level comparison. Add your own cost assumptions with formula columns when you need a broader contribution-margin model.
Improve the report with spreadsheet formulas
Useful additions include:
- Inventory value based on current cost and quantity
- Gross Profit per unit
- Recent profit versus all-time profit
- Margin bands for sorting and filtering
- A flag for blank or zero cost
- A target-margin variance column
For the existing single-metric workflow, see Shopify Orders Net Profit Analytics.
Manage Shopify data in a spreadsheet.
Use Mixtable to edit, sync, analyze, import, and export your Shopify store data without CSV juggling.