


Shopify Analytics Metrics Reference
Shopify Analytics Metrics Reference
This reference explains the Shopify analytics metrics available in Mixtable. Metric availability depends on the worksheet target and report type. Products, variants, customers, collections, B2B companies, orders, and store-level reports do not all offer the same calculations.
When you map an analytics column, Mixtable shows the metrics supported for that worksheet. The Pivot Table worksheet and Time Series worksheet builders show a focused subset designed for those report layouts.
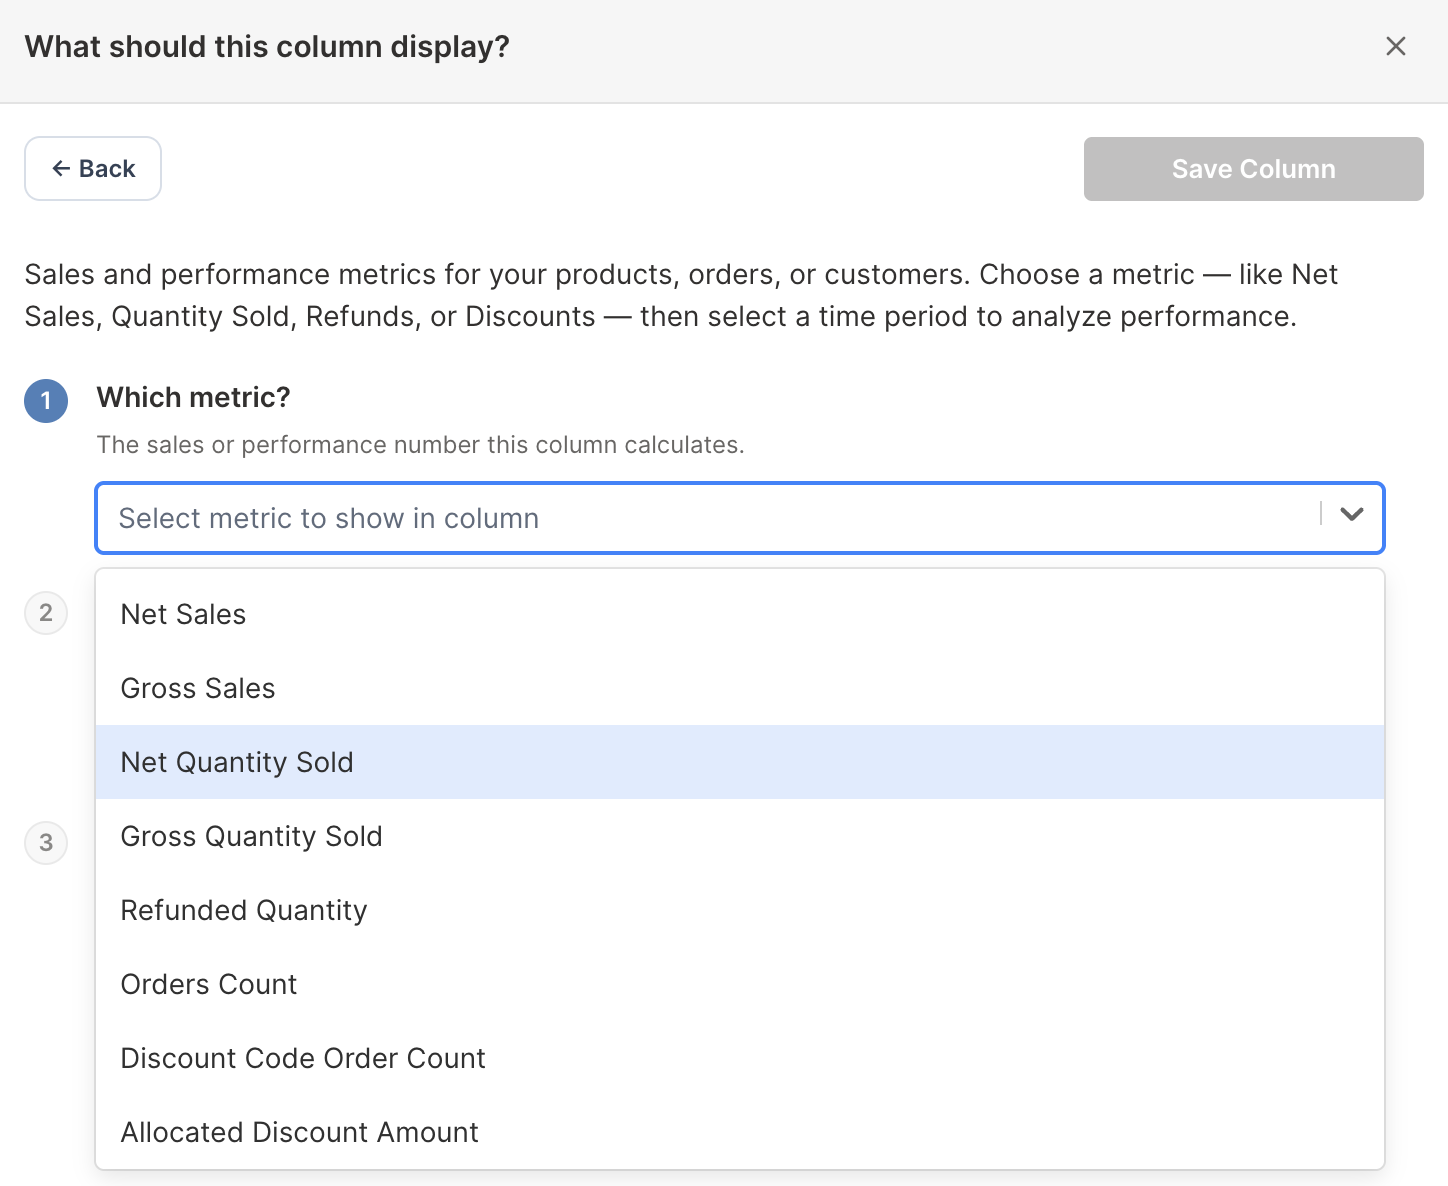
Shopify sales metrics
| Metric | What it measures | Useful comparison |
|---|---|---|
| Net Sales | Merchandise sales after discounts and returns, excluding tax | Gross Sales, discounts, and refunds |
| Gross Sales | Original merchandise value before discounts and returns | Net Sales |
| Total Sales | The broader order total, including applicable order charges and adjustments | Net Sales and the charge metrics |
| Orders Count | Distinct Shopify orders associated with the row | Average Order Value and quantities |
| Average Order Value | Sales value divided by the relevant order count | Orders Count and Net Sales |
Net Sales is the best general ranking metric when you want merchandise revenue after discounts and returns. Total Sales is better when the wider amount paid on the order matters. See:
- Shopify Net Sales analytics
- Shopify Gross Sales analytics
- Shopify Total Sales analytics
- Shopify Average Order Value analytics
Quantity metrics
| Metric | What it measures |
|---|---|
| Gross Quantity Sold | Units originally sold before returned or refunded quantities reduce the result |
| Net Quantity Sold | Units remaining after the quantity reductions included in the metric |
| Refunded Quantity | Units associated with Shopify refund activity |
| Average Order Quantity Gross | Average gross units per relevant order |
| Average Order Quantity Net | Average net units per relevant order |
Quantity metrics answer a different question from Orders Count. One Shopify order can contain several units and several products. See Shopify Refunded Quantity analytics.
Refund metrics
| Metric | What it measures |
|---|---|
| Total Refund Amount Excluding Tax | Money refunded without the refunded tax component |
| Total Refund Amount Including Tax | Refunded value including tax, where the target supports this metric |
| Refund Count | Distinct orders with refund activity associated with the row |
| Percent of Orders Refunded | Refunded-order count divided by the relevant order count |
Refund Count is not the number of refund transactions, returned units, or return requests. Shopify returns and refunds represent different parts of the post-purchase workflow.
See:
Discount metrics
| Metric | What it measures | Main availability |
|---|---|---|
| Total Discount Amount | Discount value allocated to the relevant Shopify sales | Products, variants, collections, customers, B2B targets, and store reporting where supported |
| Discount Code Order Count | Distinct orders associated with discount-code allocations | Product and product-variant analytics |
| Allocated Discount Amount | Discount value allocated to the relevant product or variant | Product and product-variant analytics |
Use the parent Shopify discount campaign filter when you need Gross Sales, Net Sales, Orders Count, quantities, or refunds for one promotion. See Shopify discount analytics.
Tax, shipping, duties, and fee metrics
| Metric | What it measures |
|---|---|
| Total Tax Amount | Shopify tax amount associated with the relevant orders |
| Total Shipping Amount | Shipping amount associated with the relevant orders |
| Total Duties | Duties associated with the relevant orders |
| Total Additional Fees | Additional order fees associated with the relevant orders |
These values help explain the difference between merchandise-focused sales metrics and broader order totals. See Shopify tax, shipping, duties, and fee analytics.
Profitability metrics
| Metric | What it measures |
|---|---|
| Orders Net Profit | Net line-item value minus current variant cost, multiplied by current quantity |
| Gross Profit | Supported sold value minus the current cost assigned to the relevant variant quantities |
| % Gross Margin | Gross Profit expressed as a share of the supported sales basis |
| Amount of Cost of Goods Sold | Current variant cost multiplied by the relevant sold quantity |
Profitability metrics depend on Shopify Cost per item. Shopify does not provide the historical cost per item from the moment an order was placed, so Mixtable uses the current variant cost. Variants without a cost cannot contribute normally to these calculations.
See Shopify profit, Gross Margin, and Cost of Goods Sold analytics.
Customer purchase metrics
| Metric | What it measures |
|---|---|
| Customer Lifetime Value | Net Sales excluding tax minus the estimated cost of the goods the customer bought, so it measures the profit that customer has produced |
| Average Orders Count | Distinct orders divided by distinct customers in the calculation |
| Product Categories Bought | Distinct Shopify standardized product categories purchased by the customer |
| Product Types Bought | Distinct custom Shopify product types purchased by the customer |
| Segments Customer Is In | Shopify customer segments associated with the customer |
Customer Lifetime Value follows the timeframe set on the column, so choose All time when you want a full lifetime figure. Because it subtracts cost, it depends on Cost per item for every variant the customer bought. If any purchased variant is missing a cost, the result shows N/A instead of a partial number. To rank customers by revenue rather than profit, use Total Sales or Net Sales.
See Shopify Customer Analytics.
Customer Journey attribution metrics
| Metric | What it measures |
|---|---|
| Orders With Attribution | Relevant Shopify orders that contain Customer Journey attribution data |
| Orders Without Attribution | Relevant Shopify orders without Customer Journey attribution data |
| Attribution Coverage Rate | Share of relevant orders that contain attribution data |
| Average Days To Conversion | Average time from the tracked customer journey to conversion |
| Median Days To Conversion | Middle conversion-time value, which reduces the influence of unusually long journeys |
Attribution metrics describe the Shopify journey data available on orders. Missing attribution does not prove that no marketing influenced the order.
See Shopify Customer Journey and marketing attribution analytics.
Fulfillment metrics
| Metric | What it measures |
|---|---|
| Fulfillment Count | Fulfillment records associated with the row |
| Fulfilled Quantity | Quantity included in the relevant fulfillments |
| Average Hours To First Fulfillment | Average time from the order to its first fulfillment |
| Average Hours To Delivery | Average time from the order to recorded delivery |
Fulfillment filters can narrow results by fulfillment status, service, location, and tracking company. See Shopify fulfillment and delivery analytics.
Return request metrics
| Metric | What it measures |
|---|---|
| Return Request Count | Shopify return requests associated with the row |
| Return Request Rate | Return requests relative to the metric’s eligible order activity |
| Return Quantity | Quantity on returned line items |
| Return Reason Count | Returned-line-item reason occurrences associated with the row |
| Open Return Count | Return requests that remain open |
| Average Hours To Close A Return | Average time between return creation and closing |
Return metrics can be filtered by return status and return reason. See Shopify return request analytics.
Where metric availability differs
Examples of target-specific availability include:
- Product Variant analytics includes profit, margin, COGS, and Orders Net Profit
- Customer analytics includes purchase-interest, segment, attribution, and return metrics
- Order analytics focuses on fulfillment, delivery, and return timing
- Company and Company Location analytics includes B2B sales, quantities, refunds, charges, and averages
- Collection analytics focuses on sales, quantities, discounts, refunds, and refunded-order percentage
- Store reporting includes the broadest storewide sales, attribution, fulfillment, and return totals
Always use the metric menu on the selected worksheet as the final availability reference.
Choose a useful supporting metric
A metric is easier to interpret when paired with its denominator or bridge:
- Net Sales with Gross Sales, discounts, and refunds
- Average Order Value with Orders Count
- Refunded Quantity with Gross Quantity Sold
- Percent of Orders Refunded with Refund Count and Orders Count
- % Gross Margin with Gross Profit and Amount of Cost of Goods Sold
- Attribution Coverage Rate with Orders With and Without Attribution
- Average delivery time with Fulfillment Count
- Return Request Rate with Return Request Count and sold quantity
Use analytics columns to place these combinations beside Shopify records, or a Pivot Table worksheet to compare them across business groups.
Manage Shopify data in a spreadsheet.
Use Mixtable to edit, sync, analyze, import, and export your Shopify store data without CSV juggling.