International Prices Template
International Prices Template
Would you like to have a 10k-foot view of your international price strategy and how it performs? With the Mixtable International Prices template, you will be able to see all your international prices in one place and, on top of that, be able to set, edit, or remove the “Compare at” price for any international market you operate on (something you currently can’t do from the Shopify admin). The best part is that you can do all this in bulk and from the convenience of a spreadsheet!
How to use the International Prices template to make data-driven decisions
With the International Prices template, you can:
-
See all international market prices in one place and update them in bulk: View all your market prices side by side in a single spreadsheet. Quickly adjust fixed prices as needed and sync them back to Shopify.
-
Compare Price Variations: The spreadsheet view of the prices and discount rates on all markets provides a full picture of your price strategy:
- Which are the products with the highest price variation across markets?
- Are there markets where prices significantly deviate from global averages?
-
Set “Compare At” prices for different markets in Shopify in bulk.
-
Check Discount Patterns: You can see and compare the discounts you offer across all markets and answer questions like:
- How do discount strategies vary by market?
- Are there any unusual discount patterns you need to take care of?
-
In addition, you also get market-specific insights:
- Are there markets that might be over or under-discounting?
- Have you achieved price consistency across different regions?
How to load the International Prices template
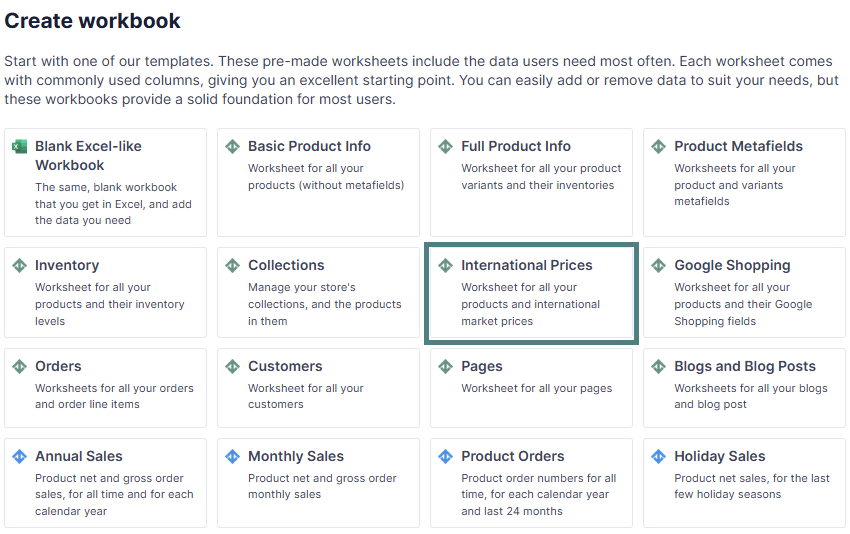
- After installing the Mixtable Spreadsheet Editor app, click the Create Spreadsheet button.
- Select the International Prices pre-built template from the list that appears in the dialog.
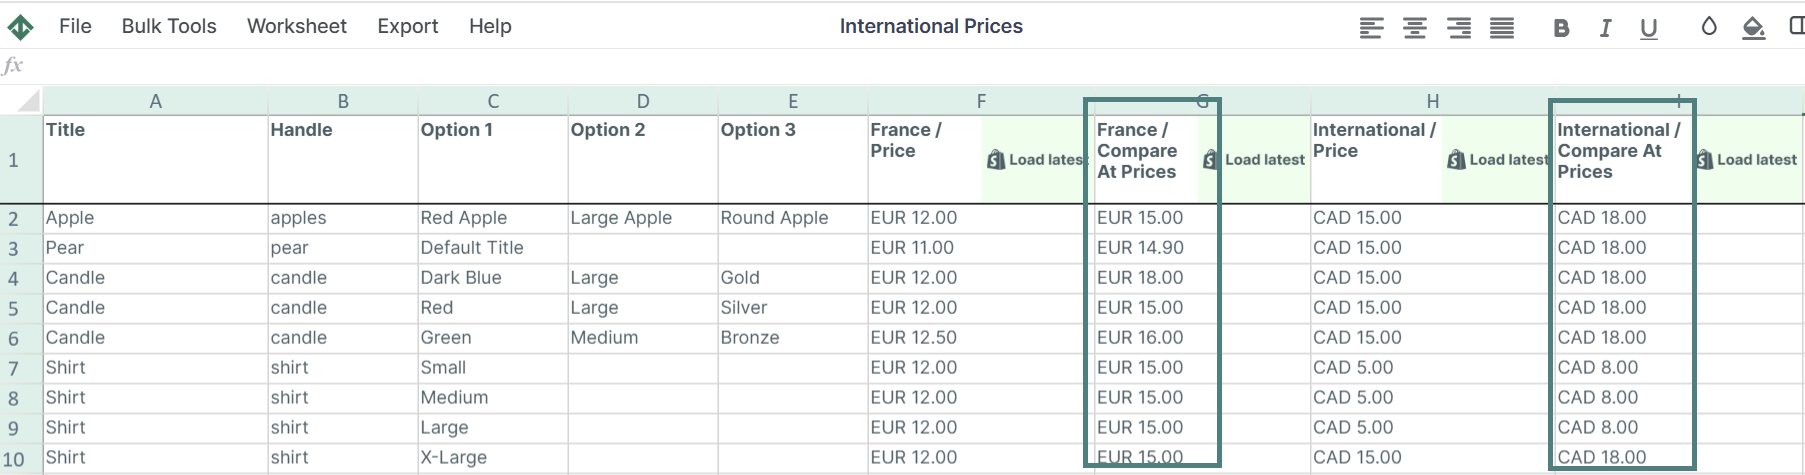
- In the spreadsheet that will start loading your data, you can view all prices per market
- You can also add Compare At prices for the different markets by simply typing them into the corresponding spreadsheet cell.
Note: Make sure you use the currency abbreviation before the price.
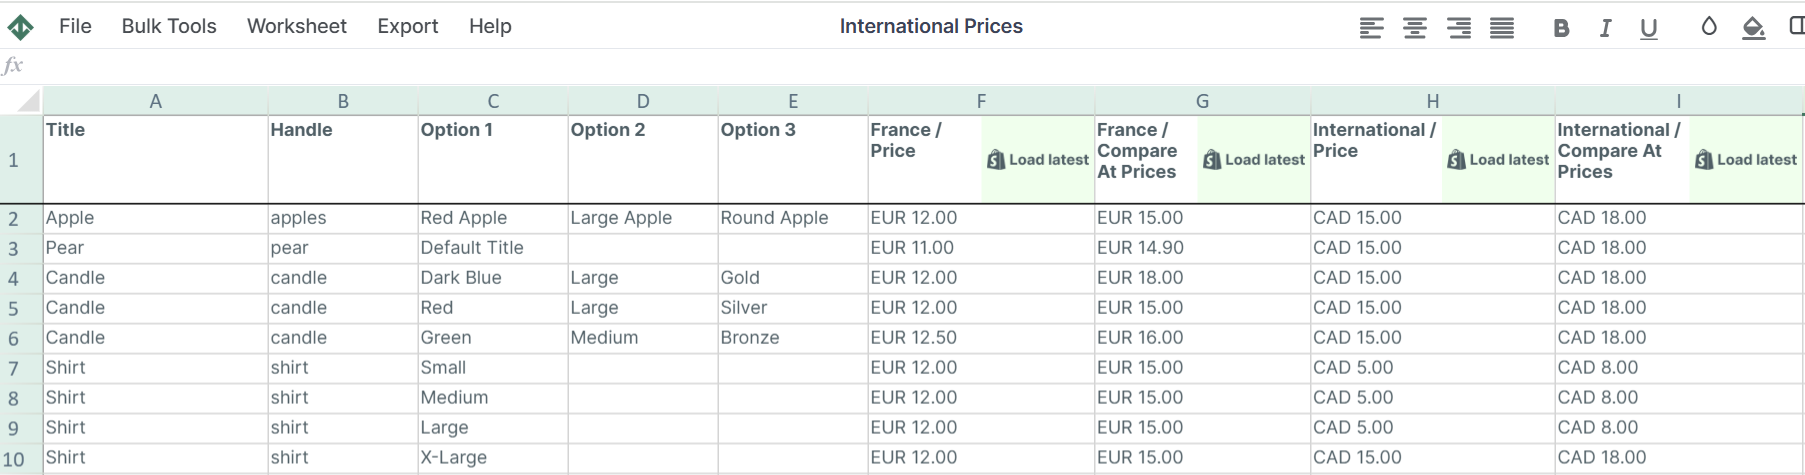
What data is included in the International Prices template
The International Prices template contains the following default columns:
- Title
- Handle
- Option 1, 2 and 3
- Price per different market
- Compare At prices per different market
In addition to the default data pulled from the International Prices template, you can map extra columns with data, such as:
- Main market’s product Prices and Compare-at prices
- Net Sales or Gross Sales (use the Mixtable Analytics Spreadsheet app)
Here’s how:
How to add default Compare At price data to your International Prices spreadsheet:
Here is how you can add your main market Price and Compare At price to the International Price template:
- To load new Shopify data, start by selecting an empty column — any column with a non-green header (green headers mean the column is already linked to Shopify data). Then, click the
 button in the column header to open the selection window to choose the data you want to pull in.
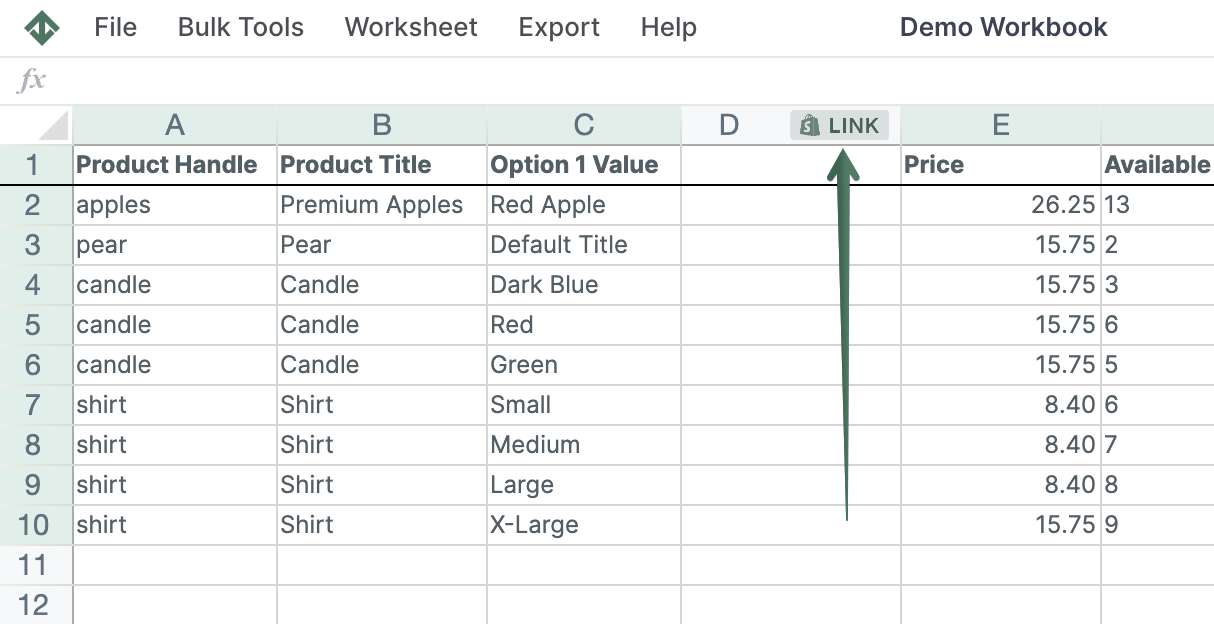
- Select Shopify data fields, and from the drop-down, choose Compare At Price.
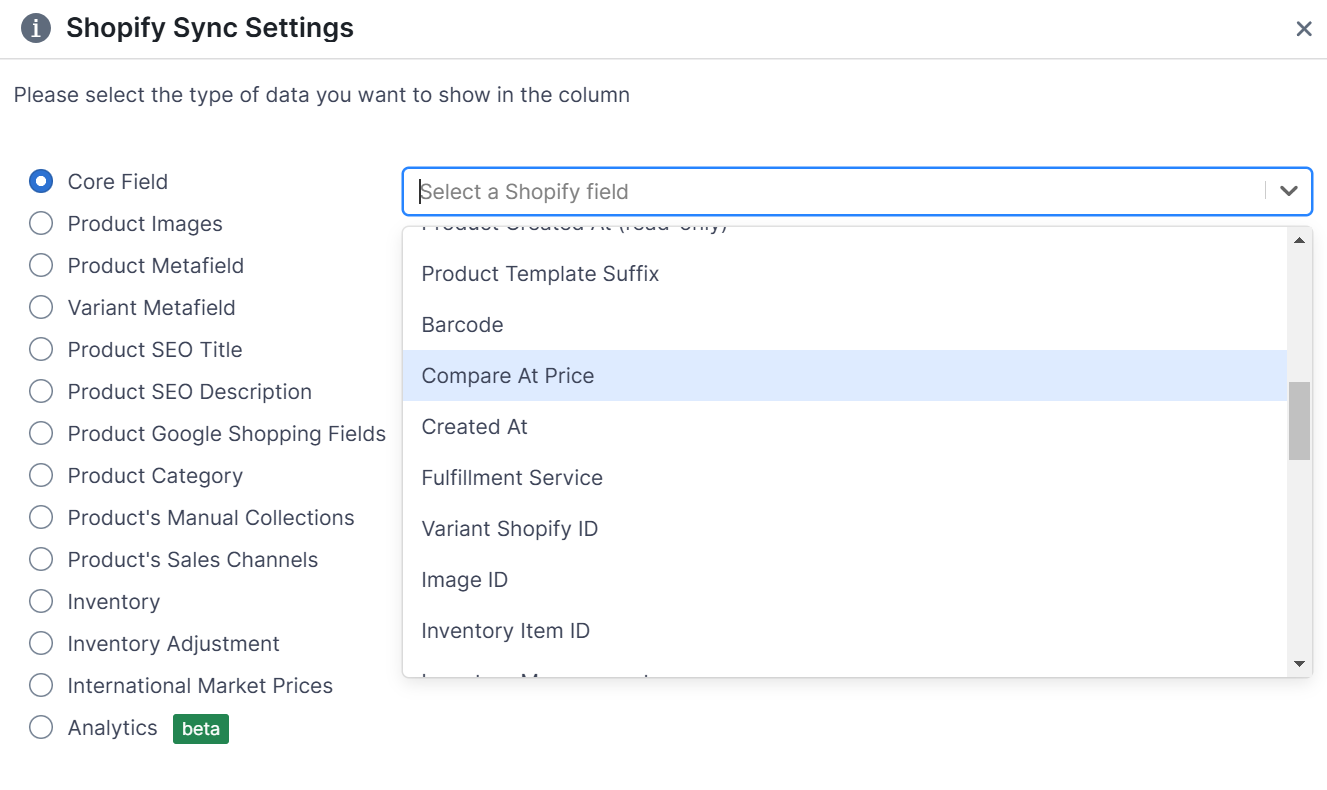
Well done! Now, you can compare international prices next to default prices. Similarly, you can add any additional Shopify data you need to improve your analysis and decisions.
How to add Net Sales data to your International Prices spreadsheet:
Integrating Net Sales alongside international prices and discount data allows for the calculation of critical metrics in Shopify, such as price elasticity, discount effectiveness, optimal price points, and market performance.
Here’s how to do it:
Note: To add Net Sales data to your International Prices spreadsheet, you need to install the Mixtable Analytics Spreadsheet app.
- To load new Shopify data, start by selecting an empty column — any column with a non-green header (green headers mean the column is already linked to Shopify data). Then, click the button in the column header to open the selection window to choose the data you want to pull in.
- From the Shopify Sync Settings window, choose Analytics > Net Sales
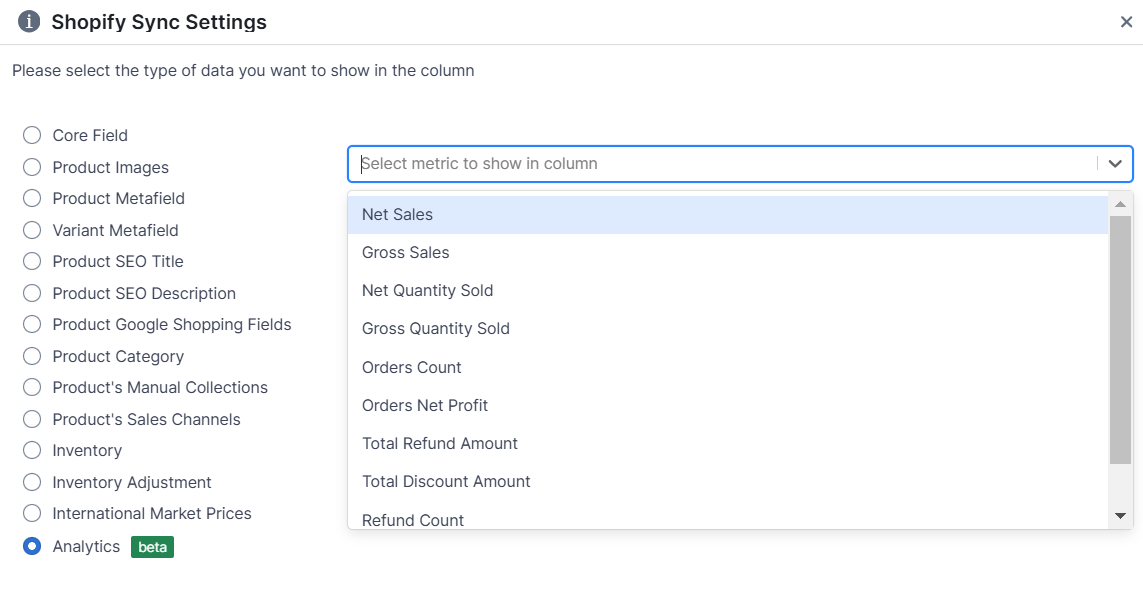
-
Select the time range for which you want the Net Sales to be calculated. For example, with the Dynamic date range > last 30 days, you will get the net sales recalculated daily as the date range window moves forward.
-
In a similar way, you can pull additional analytics data in the worksheet, such as:
Frequently Asked Questions:
Q: How to set a ‘Compare At’ price for different markets?
A: The easiest way to set Compare At price for different markets in Shopify is by using the International Prices spreadsheet template by Mixtable. Here’s what you need to do:
- Follow the steps from the beginning of this page to load the International Prices template spreadsheet.
- In the Compare At columns per each market, set the desired prices.
You're ready!
Mixtable is an online spreadsheet designed to sync data with Shopify. It looks, feels, and behaves like Excel (including formulas), but runs in your browser. With Mixtable you can:
- Bulk add products to collections, edit metafields, add or remove tags;
- Change product prices, including international prices, and review price history;
- Manage customers with a spreadsheet CRM for Shopify;
- Use Excel features like sort ascending or descending, find-replace, filter, and more.
Best of all, you can sync changes back to Shopify with a single click. Find out more about the Mixtable suite of products here.
Manage Shopify data in a spreadsheet.
Use Mixtable to edit, sync, analyze, import, and export your Shopify store data without CSV juggling.