Product Sales Metrics Template
The Product Sales Metrics spreadsheet template offers valuable insights into your Shopify store’s performance, enabling you to make more informed business decisions.
You can use the template to understand:
- Best and Worst Product Performers: By sorting the spreadsheet by Total Order Count, Gross Quantity Sold, and Net Sales (in descending order), you can easily identify your top-selling products. Conversely, sorting in ascending order will highlight underperforming items. This helps you understand which products resonate most with your audience and which might need attention or reconsideration.
- Discount Effectiveness: Analyzing the Discounts column alongside Net Sales can show you which products or discount strategies drive the most sales. You can calculate the percentage of sales attributed to discounted items and assess if the discounts are profitable in the long run.
- Return Rate Analysis: The Returns column, especially when viewed in relation to Total Order Count or Net Quantity Sold, gives you the return rate for each product. High return rates can signal problems that need to be addressed.
- Average Order Size per Product: You can calculate the average quantity of a specific product ordered per transaction by dividing Gross Quantity Sold by Total Order Count. This can inform bundling strategies or help understand typical purchase behavior for different items.
How to load the Product Sales Metrics template?
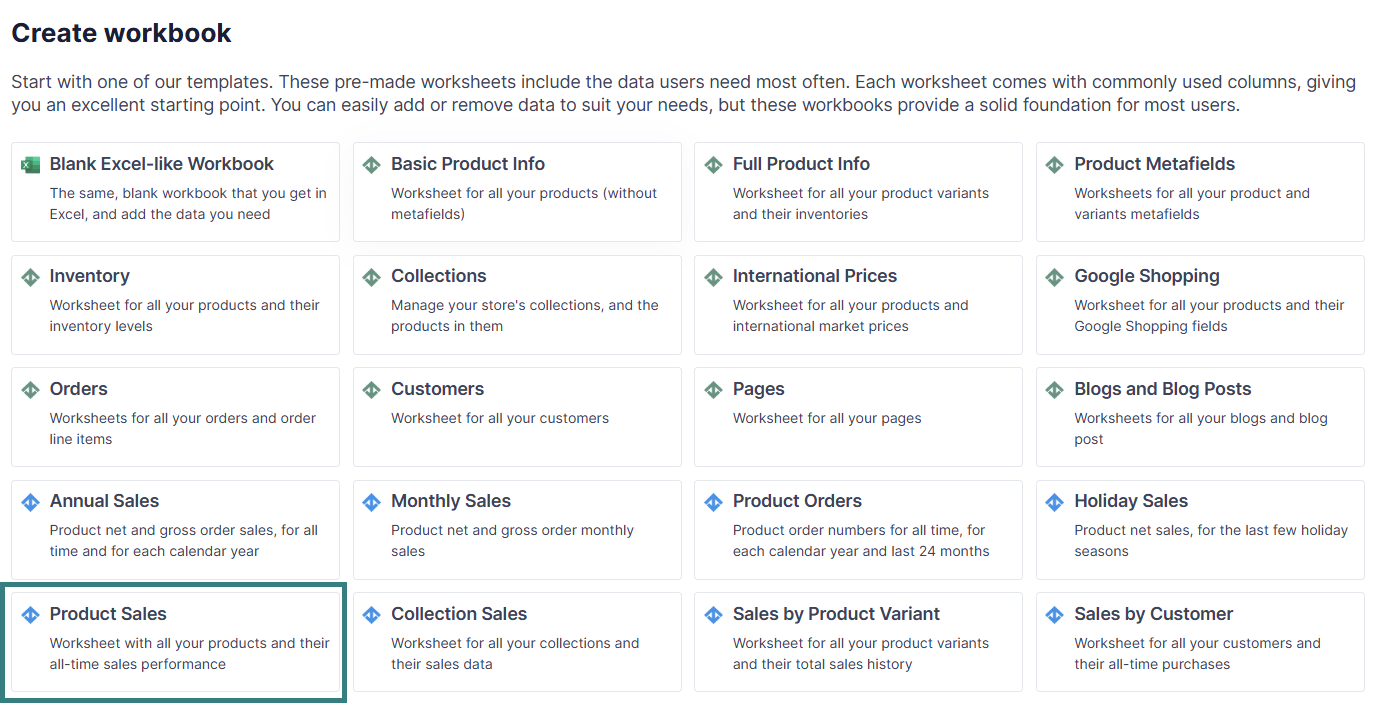
- After installing the Mixtable Analytics app, click the Create Spreadsheet button.
- Select the Product Sales Metrics pre-built template from the list.
Data included in the Product Sales Metrics template
The Product Sales Metrics Metrics template contains the following default data points:
- Product Title
- Total Order Count
- Gross Quantity Sold
- Net Quantity Sold
- Returns
- Discounts
- Net Sales
In addition to the default data pulled from Shopify, you can map extra columns with desired data. Here’s how:
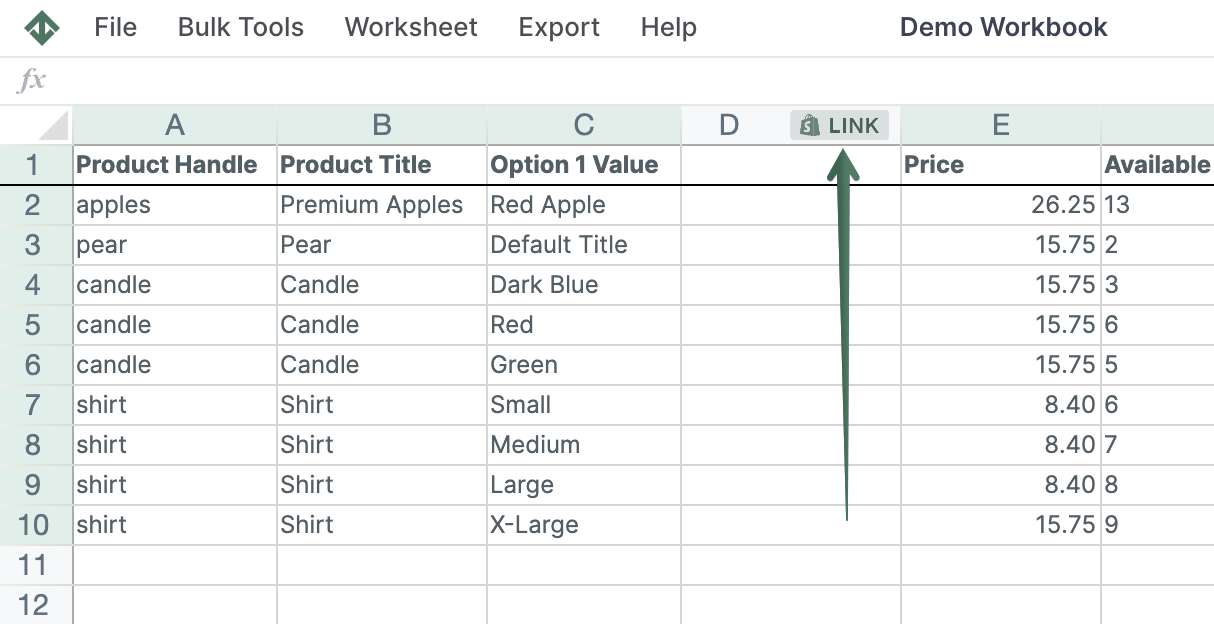
- To load new Shopify data, start by selecting an empty column — any column with a non-green header (green headers mean the column is already linked to Shopify data). Then, click the ⚡️ button in the column header to open the selection window to choose the data you want to pull in.
- From the Shopify Sync Settings window, choose a metric.
- Select a time range, if necessary.
The data will begin to populate the column.
Actions based on the Product Sales Metrics data
- Invest in top performers: Focus on marketing and inventory management for your best-selling products.
- Address underperformers: Analyze why certain products aren’t selling well. Consider discontinuing them, improving their marketing, or making product changes.
- Optimize pricing and discounts: Evaluate the effectiveness of your pricing strategies and discount campaigns.
- Improve product quality or descriptions: Investigate the reasons behind high return rates and take corrective actions.
- Refine inventory management by Utilizing sales data to forecast demand and optimize inventory levels for various products.
You're ready!
Mixtable is an online spreadsheet designed to sync data with Shopify. It looks, feels, and behaves like Excel (including formulas), but runs in your browser. With Mixtable you can:
Best of all, you can sync changes back to Shopify with a single click. Find out more about the Mixtable suite of products here.
 Analytics & Reports