 Excel & CSV Exporter
Mixtable is an online spreadsheet, designed from the ground up to bulk edit and analyze Shopify data.
Got a question? We're here to help! Reach out at [email protected], and we'll get back
to you promptly.
You can use Mixtable’s Cell History feature to see product price changes over time. Here’s how.
In a workbook, create a worksheet that shows your Shopify Product data.
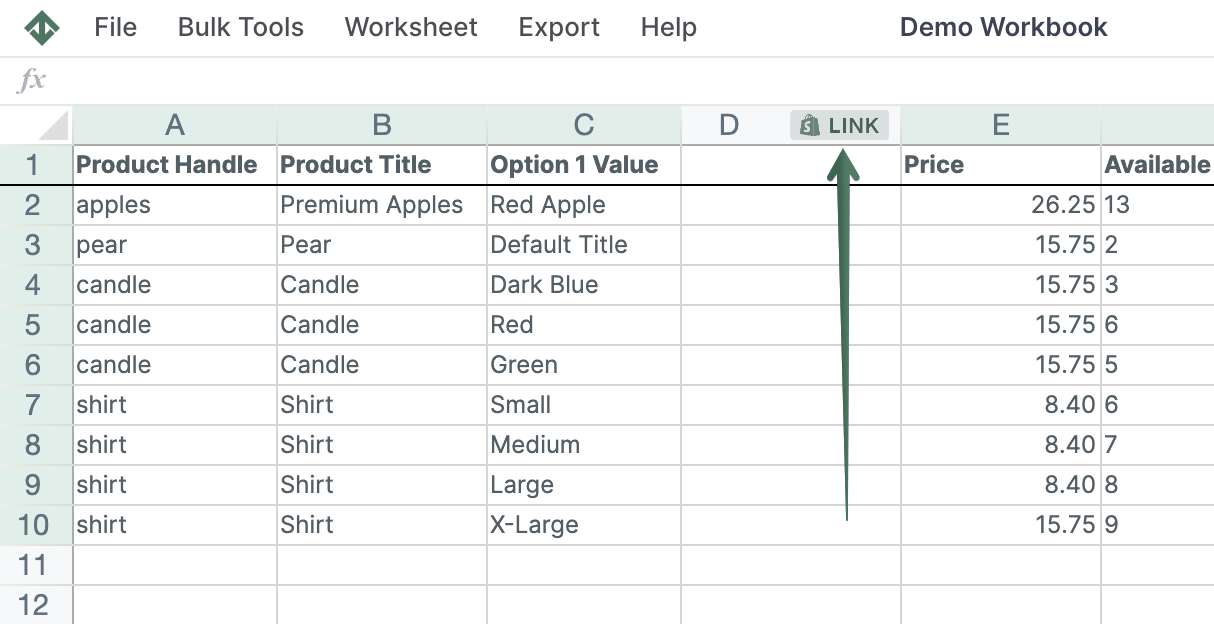
To load new Shopify data, start by selecting an empty column — any column with a non-green header (green headers mean the column is already linked to Shopify data). Then, click the ⚡️ button in the column header to open the selection window to choose the data you want to pull in.
In the dialog that opens, select the Shopify data fields option. A dropdown menu will appear, prompting you to choose the field you want to sync. Find and select the Price field. Now, click on the Save Column button.
You'll now see the column populate with any existing Price data.
Once the data has loaded, Mixtable will track all changes to the cells in this column, whether they are made by you in the spreadsheet or are changed via an update from Shopify.
You're ready!
Mixtable is an online spreadsheet designed to sync data with Shopify. It looks, feels, and behaves like Excel (including formulas), but runs in your browser. With Mixtable you can:
Best of all, you can sync changes back to Shopify with a single click. Find out more about the Mixtable suite of products here.