 Analytics & Reports
Mixtable is an online spreadsheet, designed from the ground up to bulk edit and analyze Shopify data.
Got a question? We're here to help! Reach out at [email protected], and we'll get back
to you promptly.
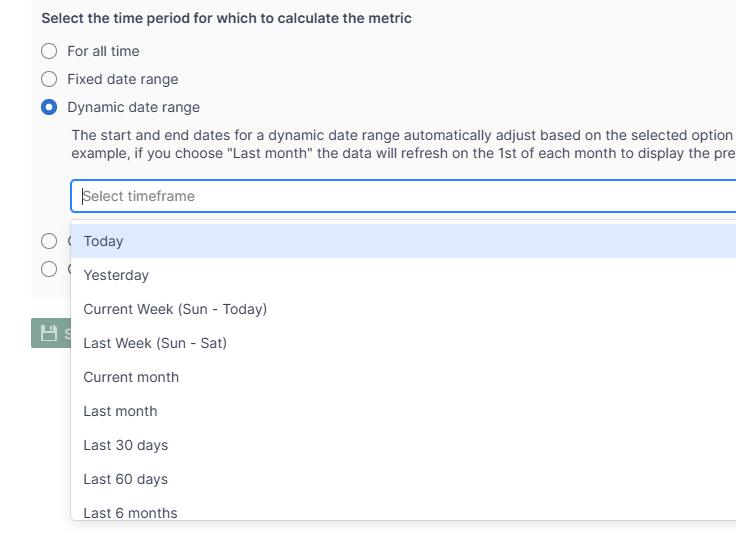
With Mixtable Analytics, you can see the total amount of money refunded in an online spreadsheet in real-time. The Last Month metric timeframe shows the data from the first to the last day of the previous calendar month and is dynamically recalculated as the date range window moves forward.
If you have already created a Mixtable workbook for your Shopify store, you can quickly add refund data for the last month to a column in a worksheet.
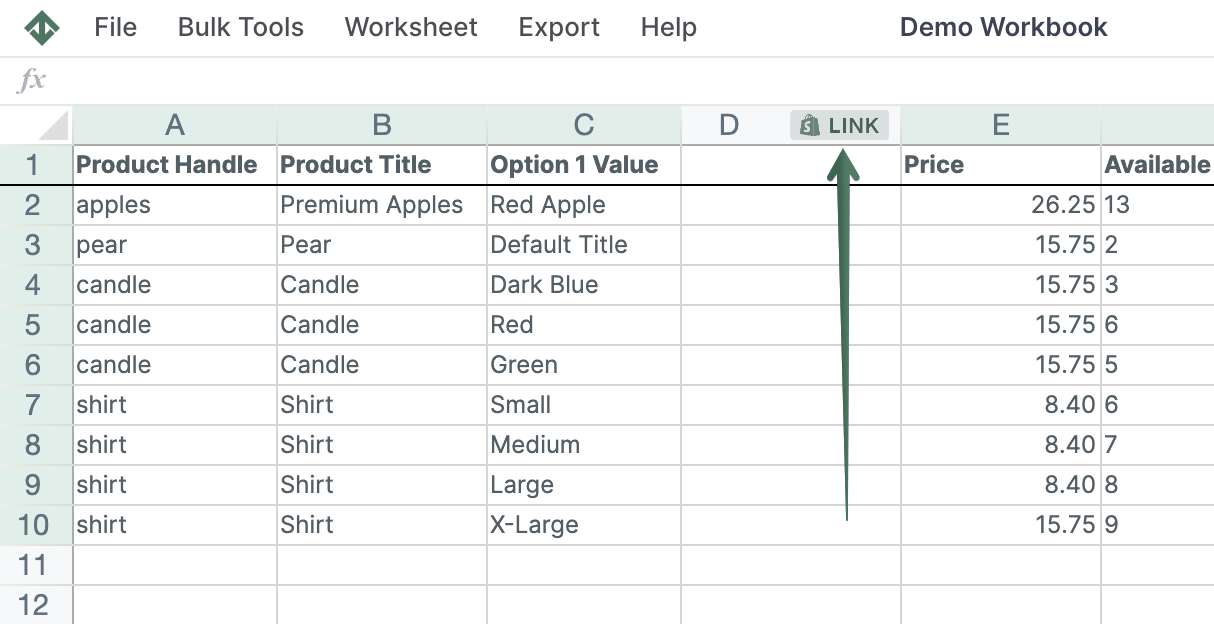
Note: The worksheet needs to show product or collection information, e.g., Products (with variants), Products (without variants), or Collections. Here you can learn how to add a new worksheet to a Mixtable workbook.
To load new Shopify data, start by selecting an empty column — any column with a non-green header (green headers mean the column is already linked to Shopify data). Then, click the ⚡️ button in the column header to open the selection window to choose the data you want to pull in.
Mixtable Analytics & Reports allows you to filter the Total Refund Amount data based on the customer segments you have created in Shopify.
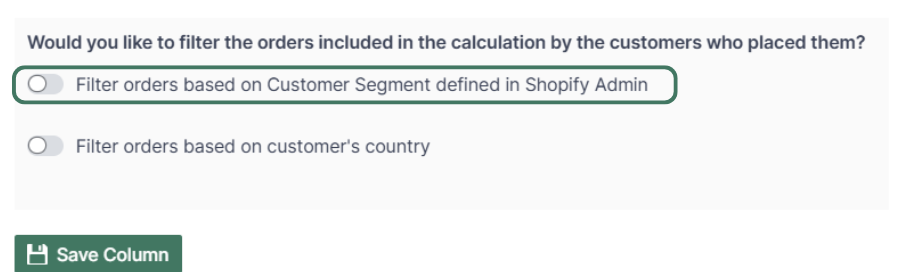
Note: The customer segments shown are the ones you have defined in your Shopify Admin. To add or change your segments please use the Shopify Admin, and Mixtable will reflect your changes automatically.
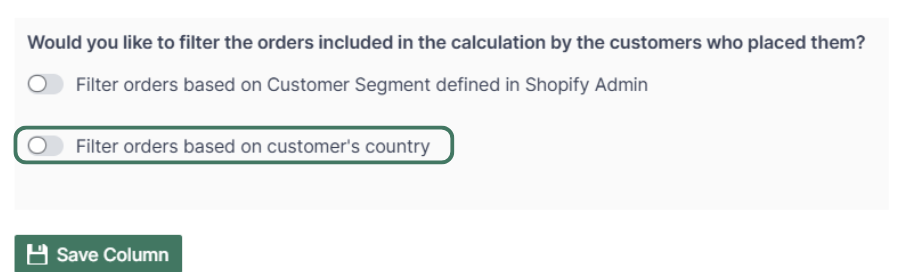
Another option for filtering the Total Refund Amount data is by the customer's country. Use this feature to calculate your international store's performance.
You are ready!
Well done! Now that you have the last month of refunds data in an online spreadsheet, you can use any Excel function to analyze the data, such as:
Find out more about the Mixtable suite of products here.