
Shopify Percent of Orders Refunded Analytics
 Analytics Spreadsheet Updated October 6, 2026
 On this page
Percent of Orders Refunded is the share of distinct orders that include a refund, for the row, breakdown, timeframe, and filters you choose.
How Percent of Orders Refunded is calculated
Percent of Orders Refunded = Refund Count ÷ Orders Count × 100
Both inputs follow the same row, timeframe, and filters, so the percentage is always internally consistent. Report it beside Refund Count and Orders Count, because the same percentage means something very different on three orders than on three hundred.
Why a rate beats a raw count
Your bestsellers will always have the most refunds, simply because they appear in the most orders. Ranking by refund count just re-lists your popular products and buries the ones with a real problem.
A rate fixes that. A product appearing in 50 orders with 15 refunded ranks ahead of one appearing in 5,000 orders with 60 refunded, which is the correct order of concern.
Use Percent of Orders Refunded to:
- Rank products, variants, and vendors by how often their orders end in a refund
- Catch a low-volume product with an unusually high refund rate before you scale it up
- Set a house threshold, then review anything above it each month
- Compare groups fairly, no matter how different their order volumes are
This is an order-based rate, not a unit-based one. Both the numerator and the denominator count distinct orders, so a single order refunded in full and one refunded by a few dollars are treated the same. Use Refunded Quantity or Return Request Rate when you need a quantity-based view.
Add Percent of Orders Refunded to a Shopify data worksheet
-
Open a supported Shopify data worksheet
-
Click + Shopify data in the header row of an empty column, or choose Column > Add Shopify data… from the menu bar. The field picker opens
-
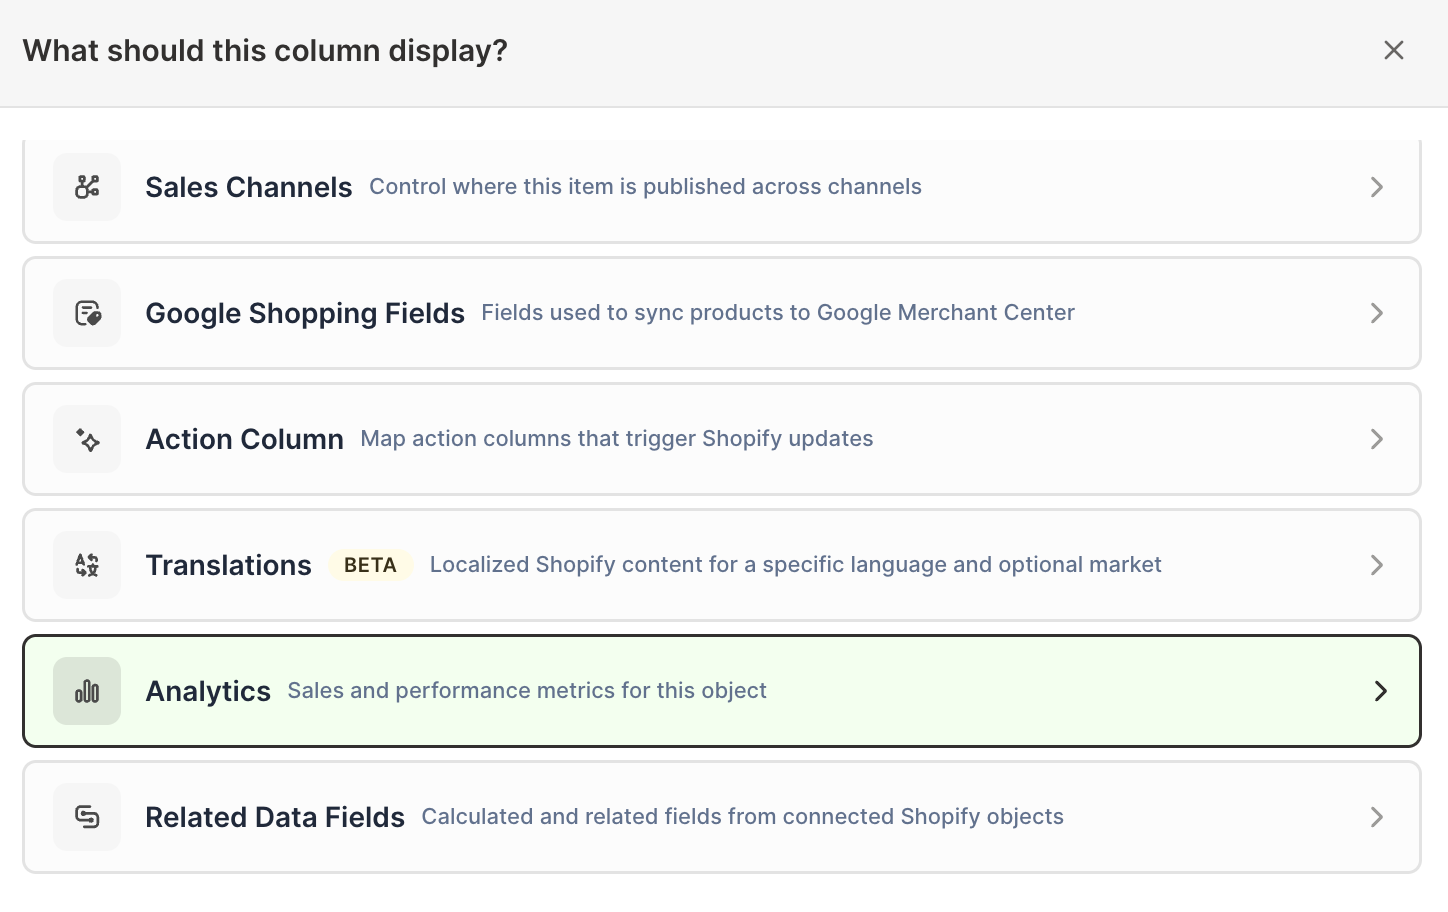
Click Sales & analytics in the list of sections on the left, or type the metric's name in the search box
-
Click Percent of Orders Refunded. The metric's settings open with it already chosen under Which metric?
-
Under Over what time period?, choose All time, Fixed dates, Rolling period, Calendar year, or Calendar month
-
Under Limit which orders count, add any optional filters supported by the metric
-
Click Save Column
On a Products worksheet, the rate is calculated separately for each product. On a Collections worksheet, it is calculated for the orders associated with each collection.
Compare refund percentages with a Pivot Table worksheet
- Click the + button beside the worksheet tabs
- Select Reporting worksheet, then click Continue
- Choose a report under Pivot table, or select Blank pivot table, then click Continue
- Under Break down by, select a breakdown such as vendor, product type, product category, product tag, market, or customer segment
- Add Percent of Orders Refunded under Metrics
- Under Time period, choose the period
- Click Create Worksheet
Always pair the percentage with Orders Count and Refund Count. A 50% refund rate across four orders is not a crisis; the same rate across four thousand is. Without the order count beside it, a rate can send you chasing the wrong product.
If you work with a house threshold, let Mixtable flag the rows above it: right-click the rate column’s letter, choose Conditional formatting…, click Add rule, pick “is greater than”, and type your threshold as a decimal (0.1 for 10%). Then click Save. See conditional formatting for more rule options.
Refund percentage and return request rate are different
Percent of Orders Refunded uses Shopify refund activity, so it reflects money actually returned to customers. Return Request Rate uses Shopify return requests and quantities, so it reflects goods customers asked to send back. A request can stay open, be declined, or close for a different amount than the final refund, and plenty of refunds happen without any return at all, which is why the two rates rarely match. Read the request rate as a signal about the goods and the refund percentage as settled cost.