Analytics for Shopify Customer Segments
Analytics for Shopify Customer Segments
Grouping customers with similar characteristics into customer segments is a great way to manage your store, create targeted campaigns, and analyze your results. You can define your customer segments in the Shopify admin or use the default customer segment templates that Shopify provides you with. Then, with Mixtable Analytics you can track the performance of the segments, further optimize them, and learn more about your customers.
Why is Customer Segment analytics Important?
- Customer Segment Analytics helps with data-driven decisions, which will improve customer engagement and conversion rates.
- Identifying customer segment patterns can increase customer retention and revenue from repeat purchases.
How to add Customer Segment analytics to your worksheet
If you have already created a Mixtable spreadsheet for your Shopify store, you can quickly add analytics data to an existing worksheet, filtered for the customer segment you want to analyze. The analytical metrics this can be done for include:
- Net Sales / Gross Sales
- Net / Gross Quantity Sold
- Orders Count
- Orders Net Profit
- Total Refund Amount
- Total Discount Amount
- Refund Count
- Percent of Orders Refunded
Add an analytics column to your Mixtable spreadsheet:
Note: The worksheet needs to show product or collection information, e.g., Products (with variants), Products (without variants), or Collections. Here you can learn how to add a new worksheet to a Mixtable spreadsheet.
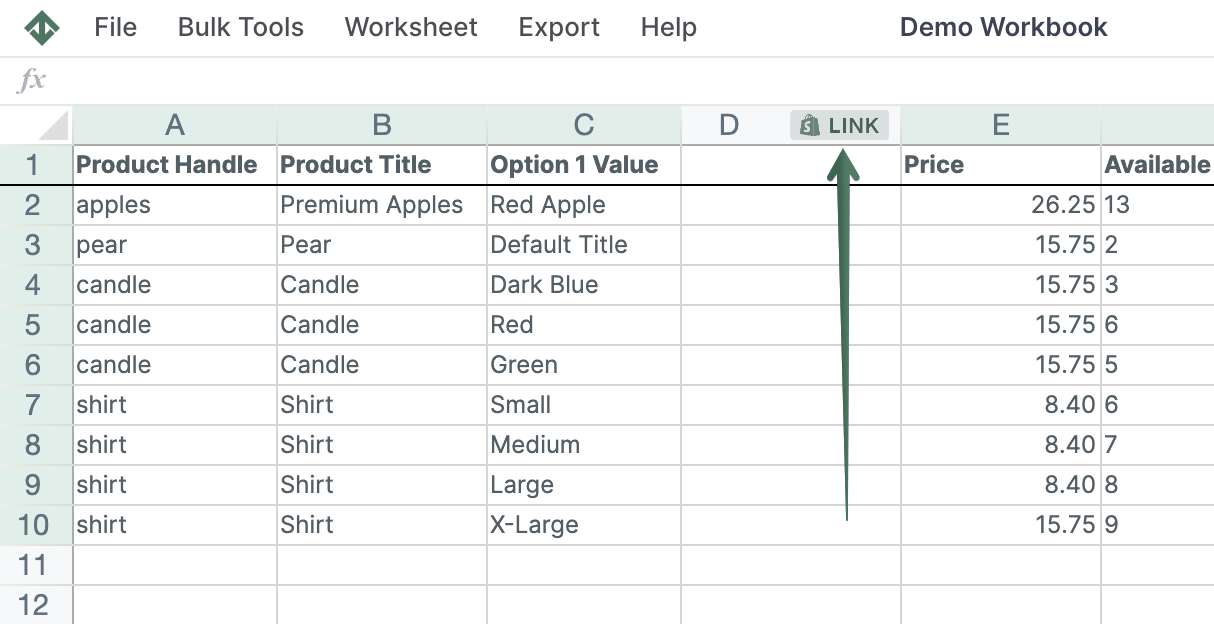
To load new Shopify data, start by selecting an empty column — any column with a non-green header (green headers mean the column is already linked to Shopify data). Then, click the  button in the column header to open the selection window to choose the data you want to pull in.
-
From the Shopify Sync Settings window, choose Analytics
-
Then, select the data metric
-
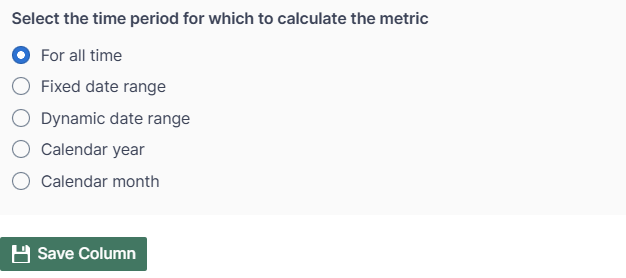
Select the time range that you want the {{object2}} to be calculated for
- All orders - all sales since the creation of the store
- Fixed date range - show data for a specific period between two dates
- Dynamic date range - calculate the data for a dynamic time period in the past, e.g., last 7 days, last 30 days. If you select this option, the data will be recalculated daily as the date range window moves forward.
- Calendar year and month - show the data for a specific year (e.g., 2023) or a particular month (e.g., August 2024)
Data comparison: Use the same Link option to add multiple columns. You can map sales from different segments, or add analytics data by customer segment for Order count, Quantity sold, Discounts, and Refunds.
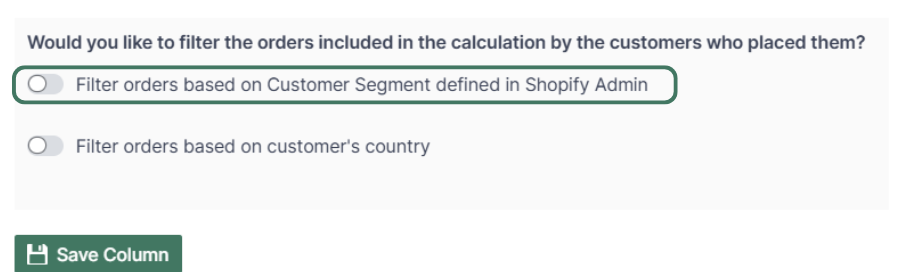
Filter data by Customer Segment
Use the Filter orders based on Customer Segment defined in Shopify Admin option to select the segment from the dropdown for which to show the metric. If you set this, the data shown in the column will only be for the customer segment you select. For example, if you choose Net Sales for calendar year 2024, and add a Customer Segment filter, then only orders bought by a customer in the specified filter will be used to calculate the net sales for 2024.
Note: The customer segments shown in the dropdown are the ones you have defined in your Shopify admin. To add or change your segments, please use the Shopify Admin, and Mixtable will reflect your changes automatically.
You are ready!
Well done! Now that you have the data in an online spreadsheet, you can use any Excel function to analyze the data, such as:
- Sort ascending or descending,
- Find-replace,
- Filter,
- Use Excel formulas, e.g., for price changes, etc.
Find out more about the Mixtable suite of products here.
Manage Shopify data in a spreadsheet.
Use Mixtable to edit, sync, analyze, import, and export your Shopify store data without CSV juggling.