


Shopify Total Discount Amount Analytics
Shopify Total Discount Amount Analytics
Total Discount Amount measures the discounts allocated to Shopify product sales for the timeframe and filters you choose. The amount excludes tax.
How Shopify Total Discount Amount is calculated
Total Discount Amount = the discount value Shopify allocates to the relevant product sales
The amount excludes tax. Discounts are also the gap between Gross Sales and Net Sales that returns do not explain, so reporting all three together shows what share of your original demand promotions consumed.
Why you should report on what you gave away
Discounts are usually the largest line of spending a store never budgets for. They do not appear as an expense, they come straight off the top, and because they are set campaign by campaign, few merchants know their annual total.
Reporting on discount amounts tells you:
- Which products sell mainly on orders that used a discount, which is worth a pricing review
- How much discount value a promotion absorbed, next to the sales on those orders
- Which vendors and categories carry the most discount value
- Whether your discount total is growing faster than your revenue
Place Total Discount Amount between Gross Sales and Net Sales and it explains most of the gap between them. That single row of three numbers is often the most useful thing on a sales report.
Add Total Discount Amount to a Shopify data worksheet
-
Open a supported Shopify data worksheet, then select an empty column or insert a new one. Empty columns have a non-green header; a green header means the column is already linked to Shopify data
-
Click the
 button in the column header
 -
Choose Analytics
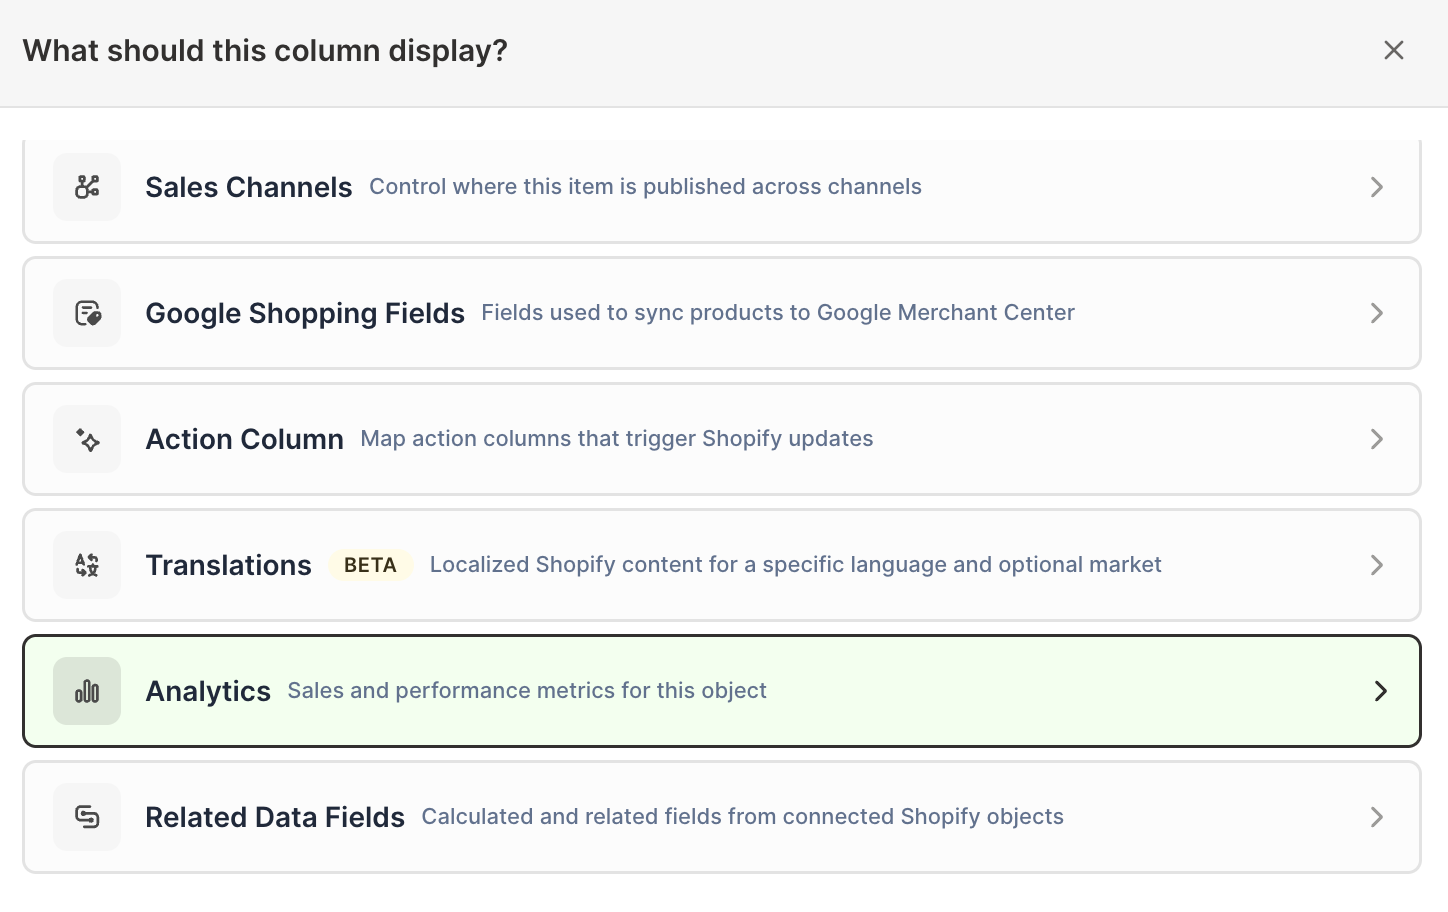
-
Under Which metric?, select Total Discount Amount
-
Under Over what time period?, choose All time, Fixed dates, Rolling period, Calendar year, or Calendar month
-
Under Limit which orders count, add any optional filters supported by the metric
-
Click Save Column
Measure a single Shopify discount campaign
Use the Discount code filter to focus the calculation on one Shopify discount campaign. The selector is searchable and groups redeem codes under their parent campaign, so a campaign that generated hundreds of unique codes still reports as one thing.
To size up a promotion, add a matched set of columns using the same timeframe and the same campaign filter:
- Total Discount Amount for the discount value allocated to those orders
- Orders Count for how many orders used the campaign
- Gross Sales for what those orders totaled before discounts
- Net Sales for what remained after discounts and refunds
Repeat the set for a second campaign and you have a like-for-like comparison of two promotions in the same spreadsheet, which is difficult to assemble any other way.
Note: These columns describe the orders that used a campaign. They do not measure incrementality, so they cannot tell you which of those orders would have happened anyway without the discount. Treat the discount amount as the value given away on those orders, not as the campaign’s full cost, which also includes any advertising and creative spend behind it.
Compare discounts with a Pivot Table worksheet
- Click the + button beside the worksheet tabs
- Select Reporting worksheet
- Select a ready-made Pivot Table report, or choose Blank pivot table
- Choose the breakdown
- Add Total Discount Amount under Metrics
- Select the timeframe and optional filters
- Click Create Worksheet
Pivot Table worksheets can compare discounts by vendor, product type, product category, product tag, collection, market, or customer segment.
Track store discounts over time
When a Time Series worksheet uses Store as its breakdown, Total Discount Amount appears as a row with monthly or yearly columns. The ready-made Store sales and orders by month report includes discounts alongside sales, orders, refunds, and Average Order Value, so you can watch discount spending as a share of sales rather than as an isolated number.
For non-store Time Series breakdowns, Total Discount Amount is not currently offered as the single measure. Use a Pivot Table worksheet with a calendar timeframe, or add filtered analytics columns, when you need a more specific comparison.
Manage Shopify data in a spreadsheet.
Use Mixtable to edit, sync, analyze, import, and export your Shopify store data without CSV juggling.