


Filter Shopify Analytics Reports
Filter Shopify Analytics Reports
Filters let one Shopify analytics metric answer a focused question. Instead of calculating Net Sales from every order, you can calculate Net Sales from one customer segment, one discount campaign, B2B orders, a fulfillment status, a marketing source, or another supported slice.
Mixtable analytics uses two different kinds of filtering:
- Metric filters control which Shopify orders contribute to a calculated metric
- Reporting-row conditions control which Shopify objects belong to a row in a Pivot Table worksheet or Time Series worksheet
These filters change the calculation itself. They are different from filtering visible worksheet rows after the values have been calculated.
Why filters are the most useful thing here
An unfiltered metric gives you one number for the whole store. That is a starting point, and almost every follow-up question needs a slice of it: not “how are sales”, but “how are sales to our wholesale accounts”, “how did the spring campaign do”, or “what do our repeat customers actually buy”.
Filters are also what lets a single worksheet compare things, because each column is filtered independently. Add Net Sales three times with three different filters and you have a side-by-side comparison that would otherwise take three exports and a pivot table.
A few things this makes easy:
- Put B2B and retail sales in adjacent columns and compare them directly
- Measure one discount campaign’s orders without hunting through individual codes
- See which products a specific customer segment buys, product by product
- Compare one sales channel or POS location against another over the same dates
- Separate a marketing channel’s revenue from everything else
The habit worth forming: change only one thing between columns. Keep the metric and the timeframe identical and vary the filter alone, or the difference you are looking at will not mean what you think.
Add a metric filter to an analytics column
- Open a supported Shopify data worksheet or Pivot Table worksheet
- Select an empty column, or insert a new column
- Click the bolt button in the column header. It is green
 on a Shopify data worksheet and blue
  on a Pivot Table worksheet
 - Choose Analytics when that choice is shown
- Under Which metric?, select the metric
- Under Over what time period?, choose a valid timeframe
- Under Limit which orders count, click to add a filter
- Select the filter type and value
- Add more filters if needed
- Click Save Column
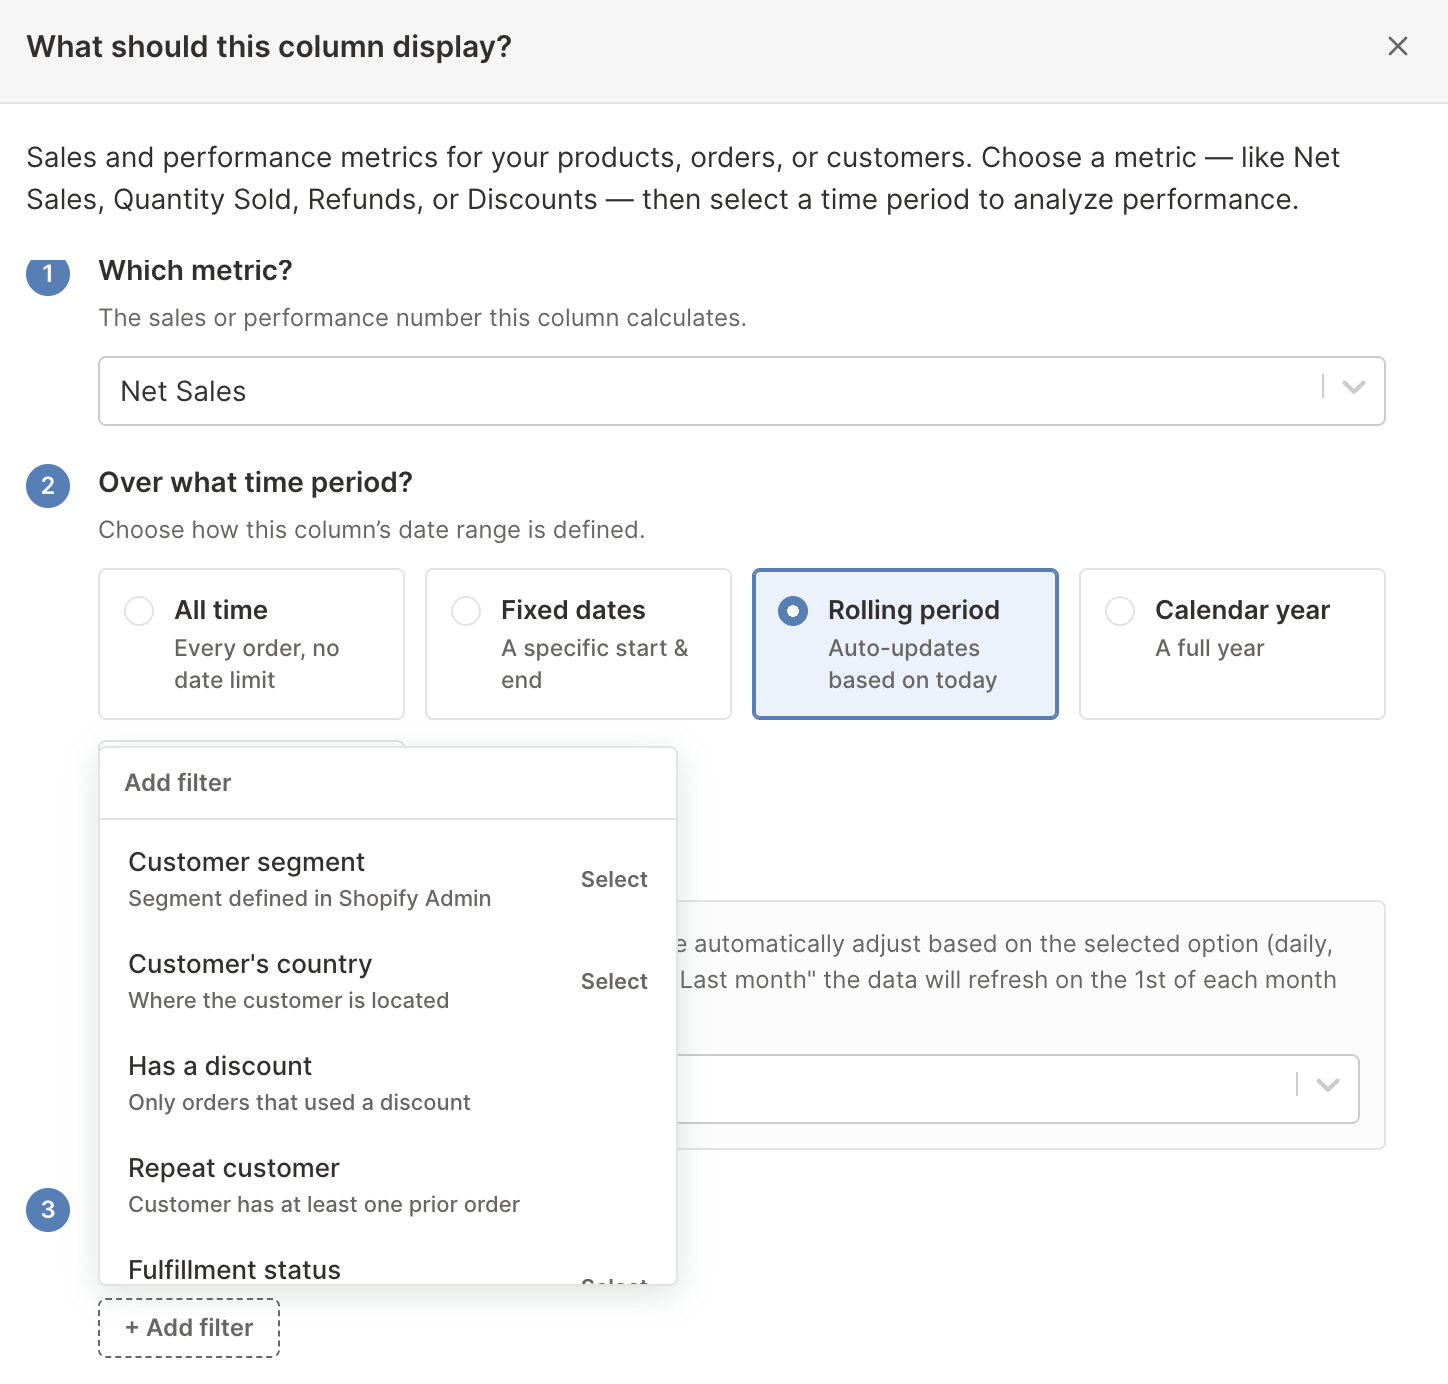
The filter menu only shows filters supported by the selected metric. A fulfillment metric, for example, can offer fulfillment-specific filters that do not apply to an ordinary sales metric.
General Shopify order filters
Depending on the metric and target, general filters can include:
| Filter | What it includes |
|---|---|
| Customer segment | Orders associated with a selected Shopify segment |
| Customer’s country | Orders associated with customers from a selected country |
| Has a discount | Only orders that used a discount |
| Repeat customer | Orders from customers with at least one prior order |
| Fulfillment status | Orders with the selected Shopify fulfillment state |
| Order type | B2B or B2C orders |
| Company | Orders associated with a selected Shopify B2B company |
| Company location | Orders associated with a selected B2B company location |
| Order source | Orders from sources such as Online Store, POS, or draft orders |
| Order app | Orders created by a selected app or sales channel |
| Publication | Orders connected to a selected Shopify publication |
| Retail location | POS orders associated with a selected Shopify location |
| Discount code | Orders associated with a selected parent Shopify discount campaign |
| Market | Orders placed in a selected Shopify Market |
Filter availability varies by metric. Mixtable hides unsupported choices rather than applying a filter that the calculation cannot use.
Filter by a Shopify discount campaign
The Discount code filter is designed for campaigns that may have many redeem codes. Its selector is searchable and presents the parent Shopify discount campaign, so you do not need to build a report code by code.
For a useful promotion comparison, add several analytics columns with the same timeframe and campaign filter:
- Gross Sales
- Total Discount Amount
- Net Sales
- Orders Count
This shows the order activity associated with the campaign. It does not prove that every order was caused by the discount, and it does not calculate incremental revenue.
See Shopify Total Discount Amount analytics.
Filter B2B Shopify analytics
To filter by Company or Company Location:
- Add Order type
- Select B2B
- Add Company or Company location
- Select the company or location
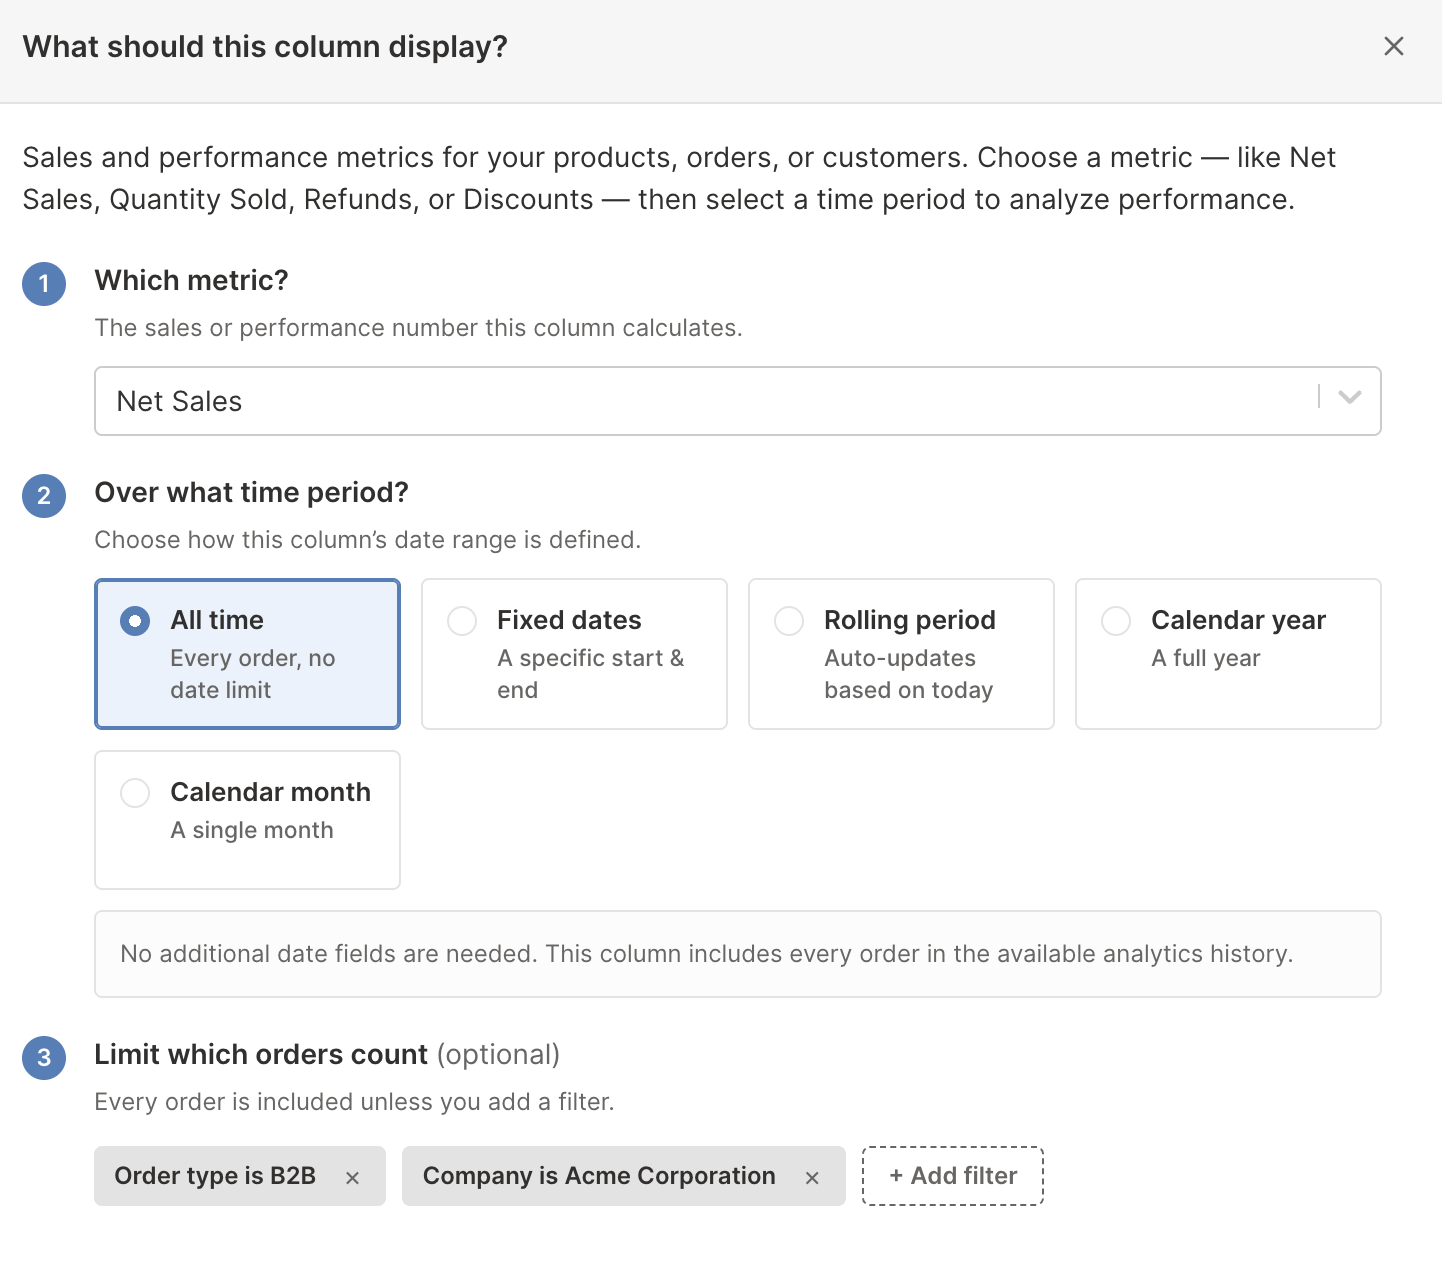
The company filters depend on the B2B order type. They do not appear as valid dependent filters when the order type is B2C.
Use the same metric and timeframe across several company-filtered columns to compare B2B accounts directly. See Shopify B2B sales analytics.
Filter Customer Journey attribution
Attribution filters include:
- Has attribution
- First-touch source and source type
- First-touch landing page and referrer
- First-touch UTM source, medium, campaign, content, and term
- Last-touch source and source type
- Last-touch landing page and referrer
- Last-touch UTM source, medium, campaign, content, and term
Attribution values can vary across stores and campaigns, so many of these selectors let you search or type the value. Use consistent campaign naming in your UTM links to make the results easier to filter.
See Shopify Customer Journey and marketing attribution analytics.
Filter fulfillment analytics
Fulfillment metrics can offer:
- Fulfillment status
- Fulfillment service
- Fulfillment location
- Tracking company
Use these filters to compare warehouses, third-party fulfillment services, or carriers. Keep the metric and timeframe identical when comparing several filtered columns.
See Shopify fulfillment and delivery analytics.
Filter return analytics
Return metrics can offer:
- Return status
- Return reason
Return reason values come from returned line items. A return request containing several items can therefore contain more than one reason.
See Shopify return request analytics.
Add reporting-row conditions
Reporting-row conditions define which Shopify objects belong to a custom Pivot Table worksheet or Time Series worksheet row. This is useful for groups that are not represented by one standard vendor, category, or tag.
- In a Pivot Table worksheet or Time Series worksheet, click the button in an empty row header
- Choose the Shopify object type to analyze
- Select Only matching objects
- Build the conditions
- Enter a row label, or keep the suggested label
- Click Save Row
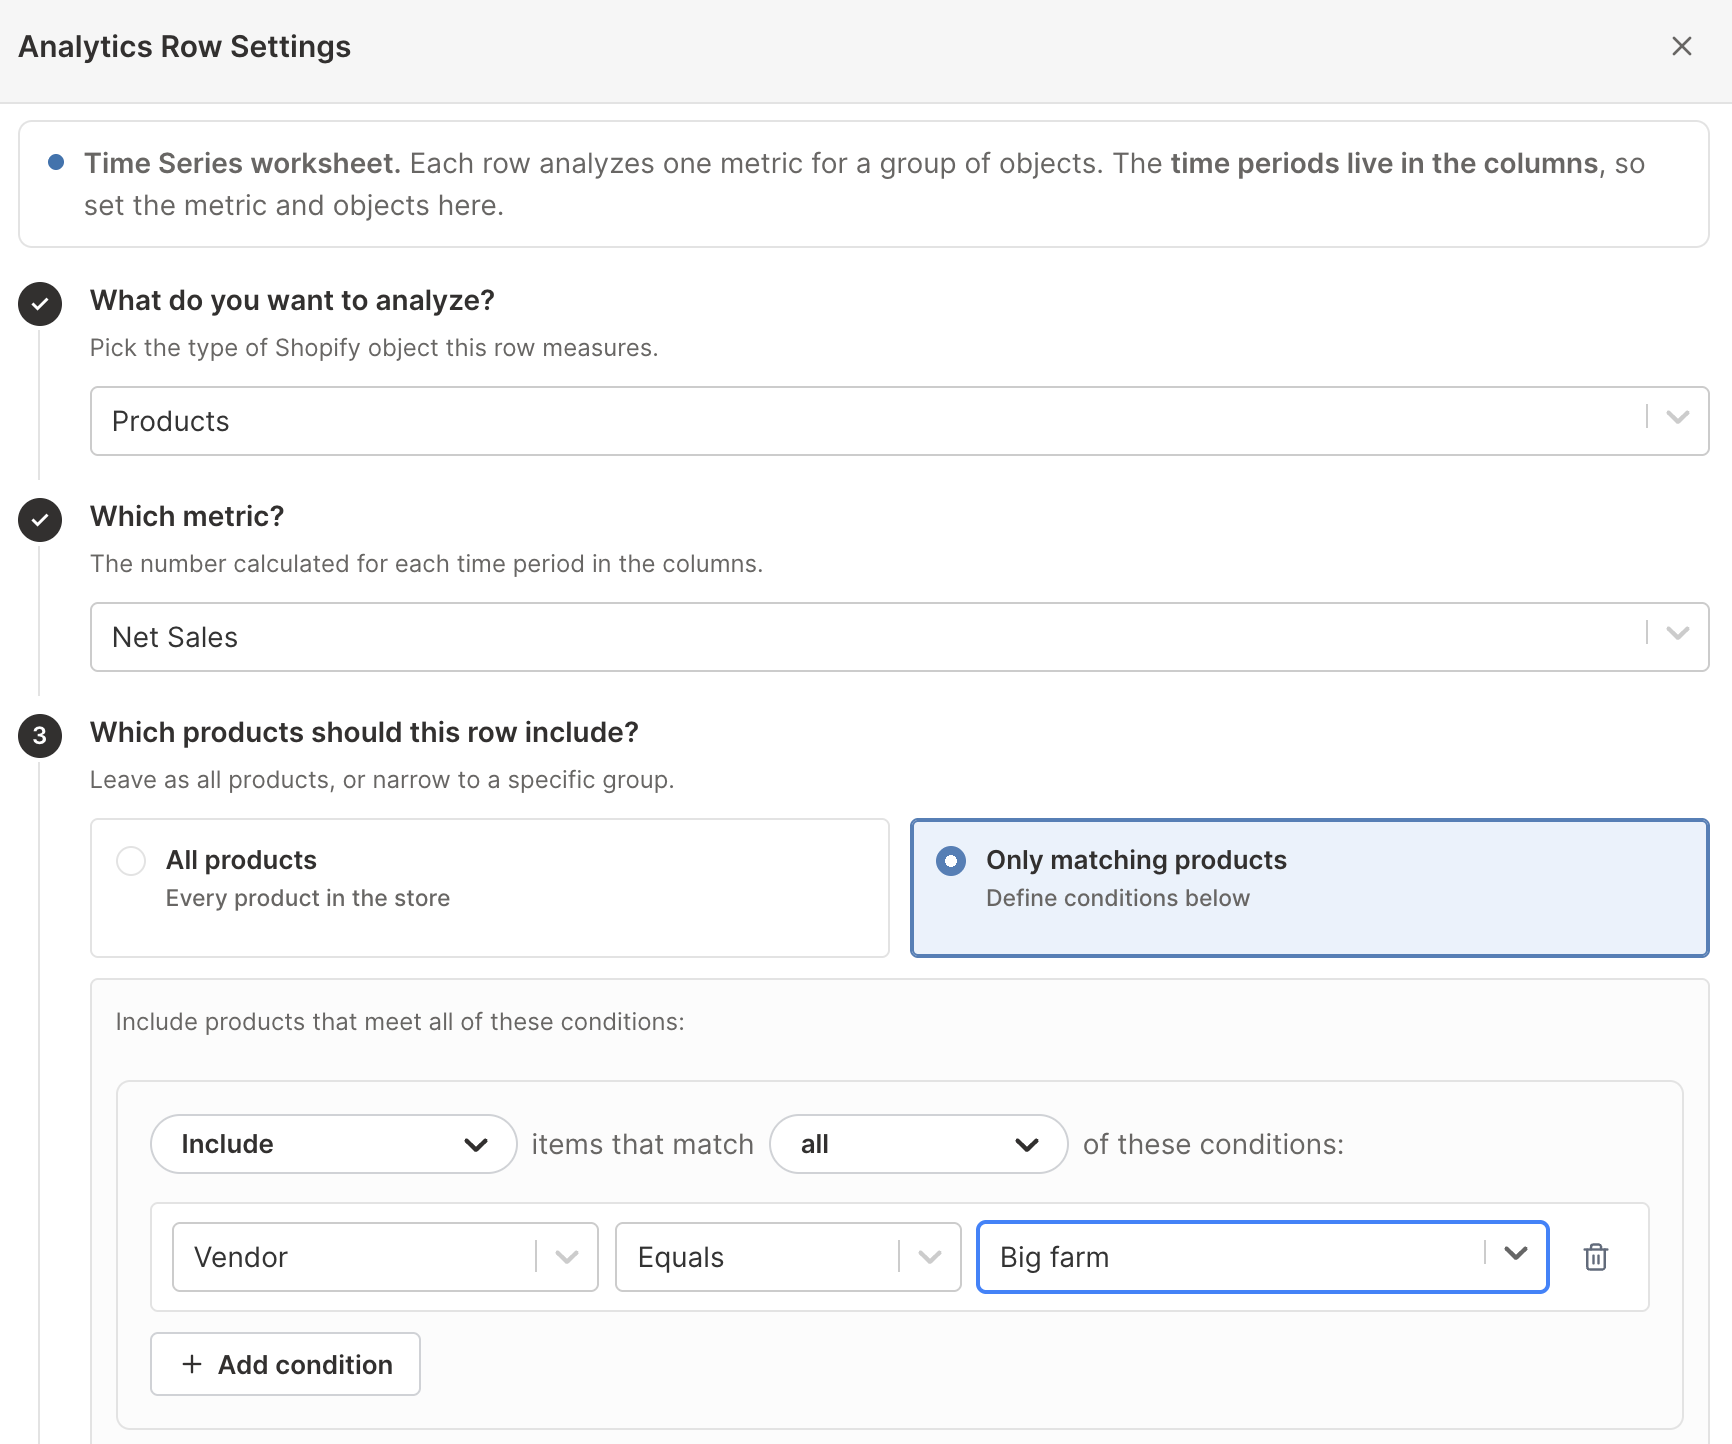
The plain-language condition builder supports object-field comparisons that are valid for analytics reporting. Conditions such as Has a value and Has no value are useful for separating complete and incomplete Shopify data without guessing what blank value to enter.
Example custom rows include:
- Active products from one vendor
- Products with no product category
- Customers with a selected tag
- Product variants where SKU has a value
- Collections whose title matches a naming convention
In a Time Series worksheet, the row also stores the selected metric and its order filters. In a Pivot Table worksheet, the row defines the objects while the metric and timeframe come from the analytics columns.
Combine filters carefully
When you add several filters to one metric, an order must satisfy the combined filter setup to count. A Net Sales column filtered to B2B, one company, and one fulfillment status is much narrower than a column using any one of those filters alone.
If a value looks unexpectedly low:
- Remove the filters one at a time to find which condition is narrowing the result
- Check that the timeframe contains relevant Shopify orders
- Confirm that attribution, fulfillment, return, company, or location data exists on those orders
- Compare the filtered metric with an unfiltered version in the next column
Analytics filters and worksheet filters are different
An analytics filter changes the value calculated in the column. A worksheet filter only hides or shows rows after values have been calculated.
For example, filtering a Products worksheet to show vendor Northwind does not change how each product’s Net Sales was calculated. Adding a metric filter changes the Shopify orders included in that Net Sales value.
Use analytics filters to define the calculation. Use worksheet filters to focus the visible report.
Manage Shopify data in a spreadsheet.
Use Mixtable to edit, sync, analyze, import, and export your Shopify store data without CSV juggling.