Shopify Customer Analytics
Shopify Customer Analytics
Mixtable customer analytics put Shopify customer fields and calculated performance metrics on the same worksheet. You can compare customers individually, build lists using filters, compare Shopify customer segments, or track segment performance over time.
What customer analytics are actually for
Most stores know their revenue and almost nothing about who produced it. Yet the difference between a customer who ordered once and one who has ordered eleven times decides how much you should spend to keep them, and it never shows up in a sales report.
Once every customer is a row with lifetime metrics beside their Shopify fields, you can:
- See who your highest-spending customers are, by total sales rather than by order count alone
- Build a win-back list of high-spend customers who have gone quiet
- Find high-spend customers with heavy refund activity, before you invite them into a loyalty program
- Understand what different customers buy, so campaigns can be relevant instead of generic
- Sort and filter the list, then export it for your email or ads platform
Because the result is a spreadsheet, you can sort, filter, and add your own formulas, then export the list to CSV or Excel for whoever needs it.
Start with Customer lifetime value & orders
This ready-made report creates a Customers worksheet with useful Shopify fields and customer-level analytics.
- Install Mixtable Analytics Spreadsheet and open your spreadsheet
- Click the + button beside the worksheet tabs
- Select Reporting worksheet, then click Continue
- Under Shopify data worksheet with analytics columns, select Customer lifetime value & orders, then click Continue
- Review the Shopify fields, analytics metrics, and row settings
- Click Create Worksheet
The report starts with customer fields such as first name, last name, email, Shopify order count, and tags. It also adds:
- Customer Lifetime Value
- Order Count
- Average Order Value
- Average Orders Count
- Total Refunded Excluding Tax
Add the refund column to the same view and you can see which of your best customers are also expensive to serve.
Note: Customer Lifetime Value measures profit rather than revenue, so it can rank customers differently than Total Sales does. If you want to know what someone has spent instead of what they have earned you, add Total Sales or Net Sales over an All time timeframe.
You can change the selected fields and analytics before creating the worksheet.
What Customer Lifetime Value measures
Customer Lifetime Value answers a profit question rather than a revenue one: how much has this customer actually made you so far?
Mixtable calculates it as the customer’s Net Sales excluding tax, minus the estimated cost of the goods they bought.
A few things are worth knowing before you rank customers by it:
- It is profit, so a big spender who buys heavily discounted or low-margin items can land below a smaller but steadier customer
- Returns pull it down on both sides, lowering the sales figure and removing the cost of the returned items
- It follows the timeframe on the column, so choose All time for a true lifetime number, or a shorter window to see recent profit
- It looks backwards at what has already happened and does not try to predict what a customer will be worth in future
- Tax, shipping, duties, and additional fees are not included, because the metric builds on Net Sales
Customer Lifetime Value needs cost data
Because the metric subtracts cost, it relies on the Cost Per Item value on your Shopify product variants.
Shopify does not record the historical cost that applied when each order was placed, so Mixtable uses each variant’s current cost, exactly as its other profit metrics do. Your current costs therefore shape the profit reported for past orders, which makes it worth keeping them accurate.
If a customer bought a variant with no cost recorded, Mixtable shows N/A for that customer rather than a partial profit figure that would understate their cost. A cost of zero counts as a real cost, so only genuinely blank costs produce N/A.
See Shopify Cost Per Item if you need to fill in missing costs in bulk.
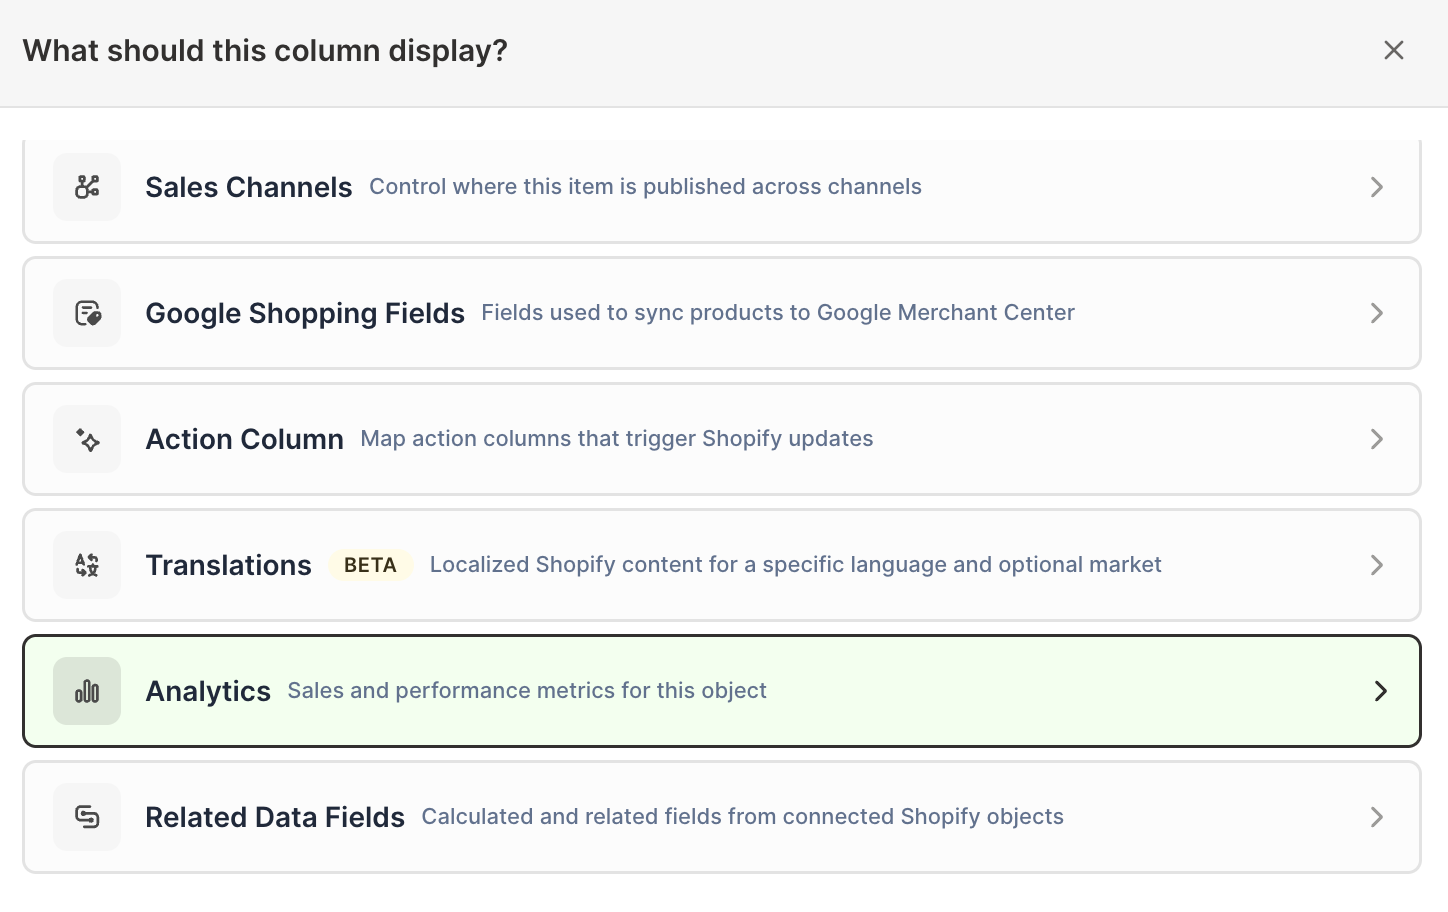
Add customer analytics to an existing worksheet
Use this method when you already have a Customers worksheet and want calculated results beside editable Shopify customer data.
-
Open a Customers worksheet, then select an empty column or insert a new one. Empty columns have a non-green header; a green header means the column is already linked to Shopify data
-
Click the
 button in the column header
 -
Choose Analytics
-
Under Which metric?, select the customer metric you want
-
Under Over what time period?, choose All time, Fixed dates, Rolling period, Calendar year, or Calendar month
-
Under Limit which orders count, add any optional filters supported by the metric
-
Click Save Column
Customer analytics include:
- Total Sales, Net Sales, Gross Sales, discounts, shipping, tax, duties, additional fees, and refunds including or excluding tax
- Order Count, Average Order Value, Average Orders Count, and average net or gross order quantity
- Customer Lifetime Value
- Product Categories Bought and Product Types Bought
- Segments Customer Is In
- Orders with or without attribution, attribution coverage, and average or median days to conversion
- Return Request Count, Return Request Rate, Open Return Count, and Average Hours To Close A Return
The available filters vary by metric. Mixtable only shows the options supported by the selected calculation.
A useful pattern is to add the same metric twice with two different timeframes, such as Net Sales for all time and Net Sales for the last 12 months. Comparing the two columns instantly separates your active customers from ones who spent heavily in the past and have since gone quiet.
Use the Sales by Customer template
Choose the Sales by Customer template when creating a new spreadsheet if you want a lifetime customer report with names, email, orders, sales, discounts, refunds, Average Order Value, product interests, and segment membership already mapped.
See Sales by Customer Template for its exact columns.
Compare Shopify customer segments
Use a Pivot Table worksheet when you want one row per Shopify customer segment rather than one row per customer. This is the view for deciding where marketing budget should go, since it compares whole audiences rather than individuals.
- Add an Reporting worksheet
- Under Pivot table, choose Customer segment contribution
- Review or change the metrics and timeframe
- Add optional filters if needed
- Click Create Worksheet
The ready-made report compares Total Order Count, Gross Sales, Total Discounts, Total Refund Amount Excluding Tax, Net Sales, and Average Order Value.
Use Customer segment net sales by month in the Time Series section to see whether a segment’s sales are rising or falling across monthly or yearly periods.
Note: Segment reports measure sales and order activity for the customers currently in each segment. Shopify segment membership is evaluated as it stands today, not as it stood when each order was placed, and Mixtable does not track how many customers a segment contained in the past. A falling line means the segment’s sales are declining, which is not the same as the segment losing members.
Product categories, product types, and segment membership
Product Categories Bought uses Shopify’s standardized product taxonomy. Product Types Bought uses the custom product types assigned to products in your store. Both are useful for cross-sell campaigns: they let you find everyone who has bought from one category and never touched a related one.
Segments Customer Is In lists the Shopify segments each customer currently belongs to. It does not need a date range, because it describes current membership rather than order activity.
Customer rows and segment rows answer different questions
Use a Customers worksheet to rank, filter, or act on individual customer records. Use a customer segment Pivot Table worksheet or Time Series worksheet to compare audiences as groups.
A customer can qualify for more than one Shopify segment, so the same order can contribute to more than one segment row.
Manage Shopify data in a spreadsheet.
Use Mixtable to edit, sync, analyze, import, and export your Shopify store data without CSV juggling.