
Shopify Sell-Through Rate, Inventory Turnover, and Dead Stock
 Analytics Spreadsheet Updated October 6, 2026
 On this page
Sales tell you what sold. Stock tells you what’s left. Put the two together and you can see which products turn into cash quickly, which ones will run out soon, and which ones haven’t sold at all. These five inventory metrics in Mixtable Analytics Spreadsheet compare your stock history with your Shopify orders over the same days.
| Metric | What it shows |
|---|---|
| Sell-Through Rate | Units sold as a share of units sold plus the stock left at the end |
| Inventory Turnover | Units sold during the period divided by Average Daily Stock |
| Days of Stock Left | How many days the closing stock lasts at the pace the variant sold on its in-stock days |
| Dead Stock Units | Stock left at the end on variants that sold nothing during the period |
| Dead Stock Value at Cost | What that dead stock cost you |
They are part of Mixtable’s 18 inventory metrics. For where the numbers come from, how the history downloads, and the date rules every inventory metric follows, start with the Shopify inventory analytics guide.
How units sold are counted
All five metrics use the same measure of sales: Net Quantity Sold, the units customers ordered minus the units they returned, calculated from your Shopify orders over the same days as the stock.
- Same variants: only variants that track inventory and have a stock record in the period count, so the sales and the stock always describe the same items
- Every location: Shopify orders aren’t split by stock location, so Sell-Through Rate, Inventory Turnover, and Days of Stock Left always count every location. Dead stock is the exception, explained below
- Returns count against sales: units returned during the period are subtracted, so on its own row a variant with more returns than sales counts as selling nothing
Sell-Through Rate
Sell-Through Rate = units sold ÷ (units sold + Closing Stock)
Sell-Through Rate answers “of the stock we had to sell, how much did we sell?” For example, a variant that sold 60 units during the period and ended it with 40 has a Sell-Through Rate of 60 ÷ (60 + 40) = 60%.
Units sold plus what’s left stands in for the stock you had available over the period. That keeps the rate meaningful even when you restock partway through, which a rate based on opening stock alone would not.
- Negative stock: a variant that ended the period oversold counts as having no stock left
- Groups: a product, collection, or report row adds up units sold and closing stock across its variants first, then divides, so one variant’s returns can offset another’s sales
- No sales or stock: when nothing sold and nothing is left, the cell shows No sales or stock
Sell-Through Rate reads best over a season or a fixed window, such as the weeks since a collection launched. Pick the window with Fixed dates or Rolling period.
Inventory Turnover
Inventory Turnover = units sold ÷ Average Daily Stock
Inventory Turnover tells you how many times you sold through your average stock during the period. For example, a product that sold 90 units over the last 30 days while holding 45 units on an average day turned over 90 ÷ 45 = 2.00 times.
Mixtable calculates turnover for the period you pick and doesn’t annualize it. To compare it with a yearly benchmark, multiply by 365 and divide by the number of days in the period: 2.00 over 30 days is about 24 a year. Or choose Calendar year for a year’s turnover directly.
Average Daily Stock counts days without stock as zero, so a product that was out of stock for much of the period shows a higher turnover. When the average stock is zero or below, the cell shows No stock.
Days of Stock Left
Days of Stock Left = Closing Stock ÷ (units sold ÷ Days In Stock)
Days of Stock Left estimates how long the stock left at the end of the period will last if the variant keeps selling at the same pace. The pace counts only the days the variant was in stock, so a stockout doesn’t make it look like a slow seller.
For example, over the last 30 days a variant sold 45 units and was in stock for 15 of those days. It sold 45 ÷ 15 = 3 units per in-stock day. With 36 units left, it has 36 ÷ 3 = 12.00 days of stock left.
- The period sets the pace: Last 30 days reflects how the variant is selling now, and Last 60 days or Last 6 months smooths out a single busy week
- Out of stock: a variant with no stock left at the end of the period shows 0.00
- No sales: a variant with stock but no units sold shows No sales, since there is no pace to divide by
Days of Stock Left is counted per variant, so it’s only available on Products (with variants) worksheets.
Dead Stock Units and Dead Stock Value at Cost
Dead Stock Units = the Closing Stock of variants that sold nothing during the period
Dead Stock Value at Cost = the Closing Value at Cost of those same variants
A variant is dead stock for the period when its units sold are zero or below. Its stock left at the end then counts as dead, and a variant that sold even one unit counts as zero. For example, if 3 of a product’s 5 variants sold nothing over the last 6 months and ended it with 12, 8, and 4 units, the product has 24 Dead Stock Units.
- Locations: unlike the other metrics on this page, the dead stock metrics let you choose stock locations. Mixtable decides whether a variant is dead from its sales anywhere, then counts its stock at the locations you pick. That makes it easy to find dead stock sitting in one warehouse
- Value at cost: Dead Stock Value at Cost uses the same rules as Closing Value at Cost: each variant’s cost per item on that day, and units without a cost left out. So it can be lower than Dead Stock Units multiplied by cost
- New arrivals count too: stock received near the end of the period hasn’t had time to sell, but it still counts as dead. Pick a period long enough for your products to have had a fair chance, and add a Stock Change column for the same period to spot stock that arrived recently
Dead stock only catches variants that sold nothing. For products that sell, but slowly, use a low Sell-Through Rate or a long Days of Stock Left instead.
Where you can use these metrics
| Metric | Variants | Products | Collections | Report rows | Location rows |
|---|---|---|---|---|---|
| Sell-Through Rate | Yes | Yes | Yes | Yes | No |
| Inventory Turnover | Yes | Yes | Yes | Yes | No |
| Days of Stock Left | Yes | No | No | No | No |
| Dead Stock Units | Yes | Yes | Yes | Yes | Yes |
| Dead Stock Value at Cost | Yes | Yes | Yes | Yes | Yes |
Variants and Products are Products (with variants) and Products (no variants) worksheets. Report rows are Pivot Table and Time Series rows for a vendor, product type, product category, or product tag, and Store rows. Location rows leave out Sell-Through Rate and Inventory Turnover because sales aren’t split by location.
On a group of products, each metric adds up the variants in the group. Store totals for these metrics count only the variants you have today, so deleted variants aren’t part of them.
Build a reorder list
Put Days of Stock Left beside each variant’s SKU, vendor, and stock to see what needs reordering first.
-
Open a Products (with variants) worksheet. To add one, click the + at the end of the worksheet tabs, or choose Worksheet > Add worksheet…
-
Click + Shopify data in the header row of an empty column, or choose Column > Add Shopify data… from the menu bar. The field picker opens
-
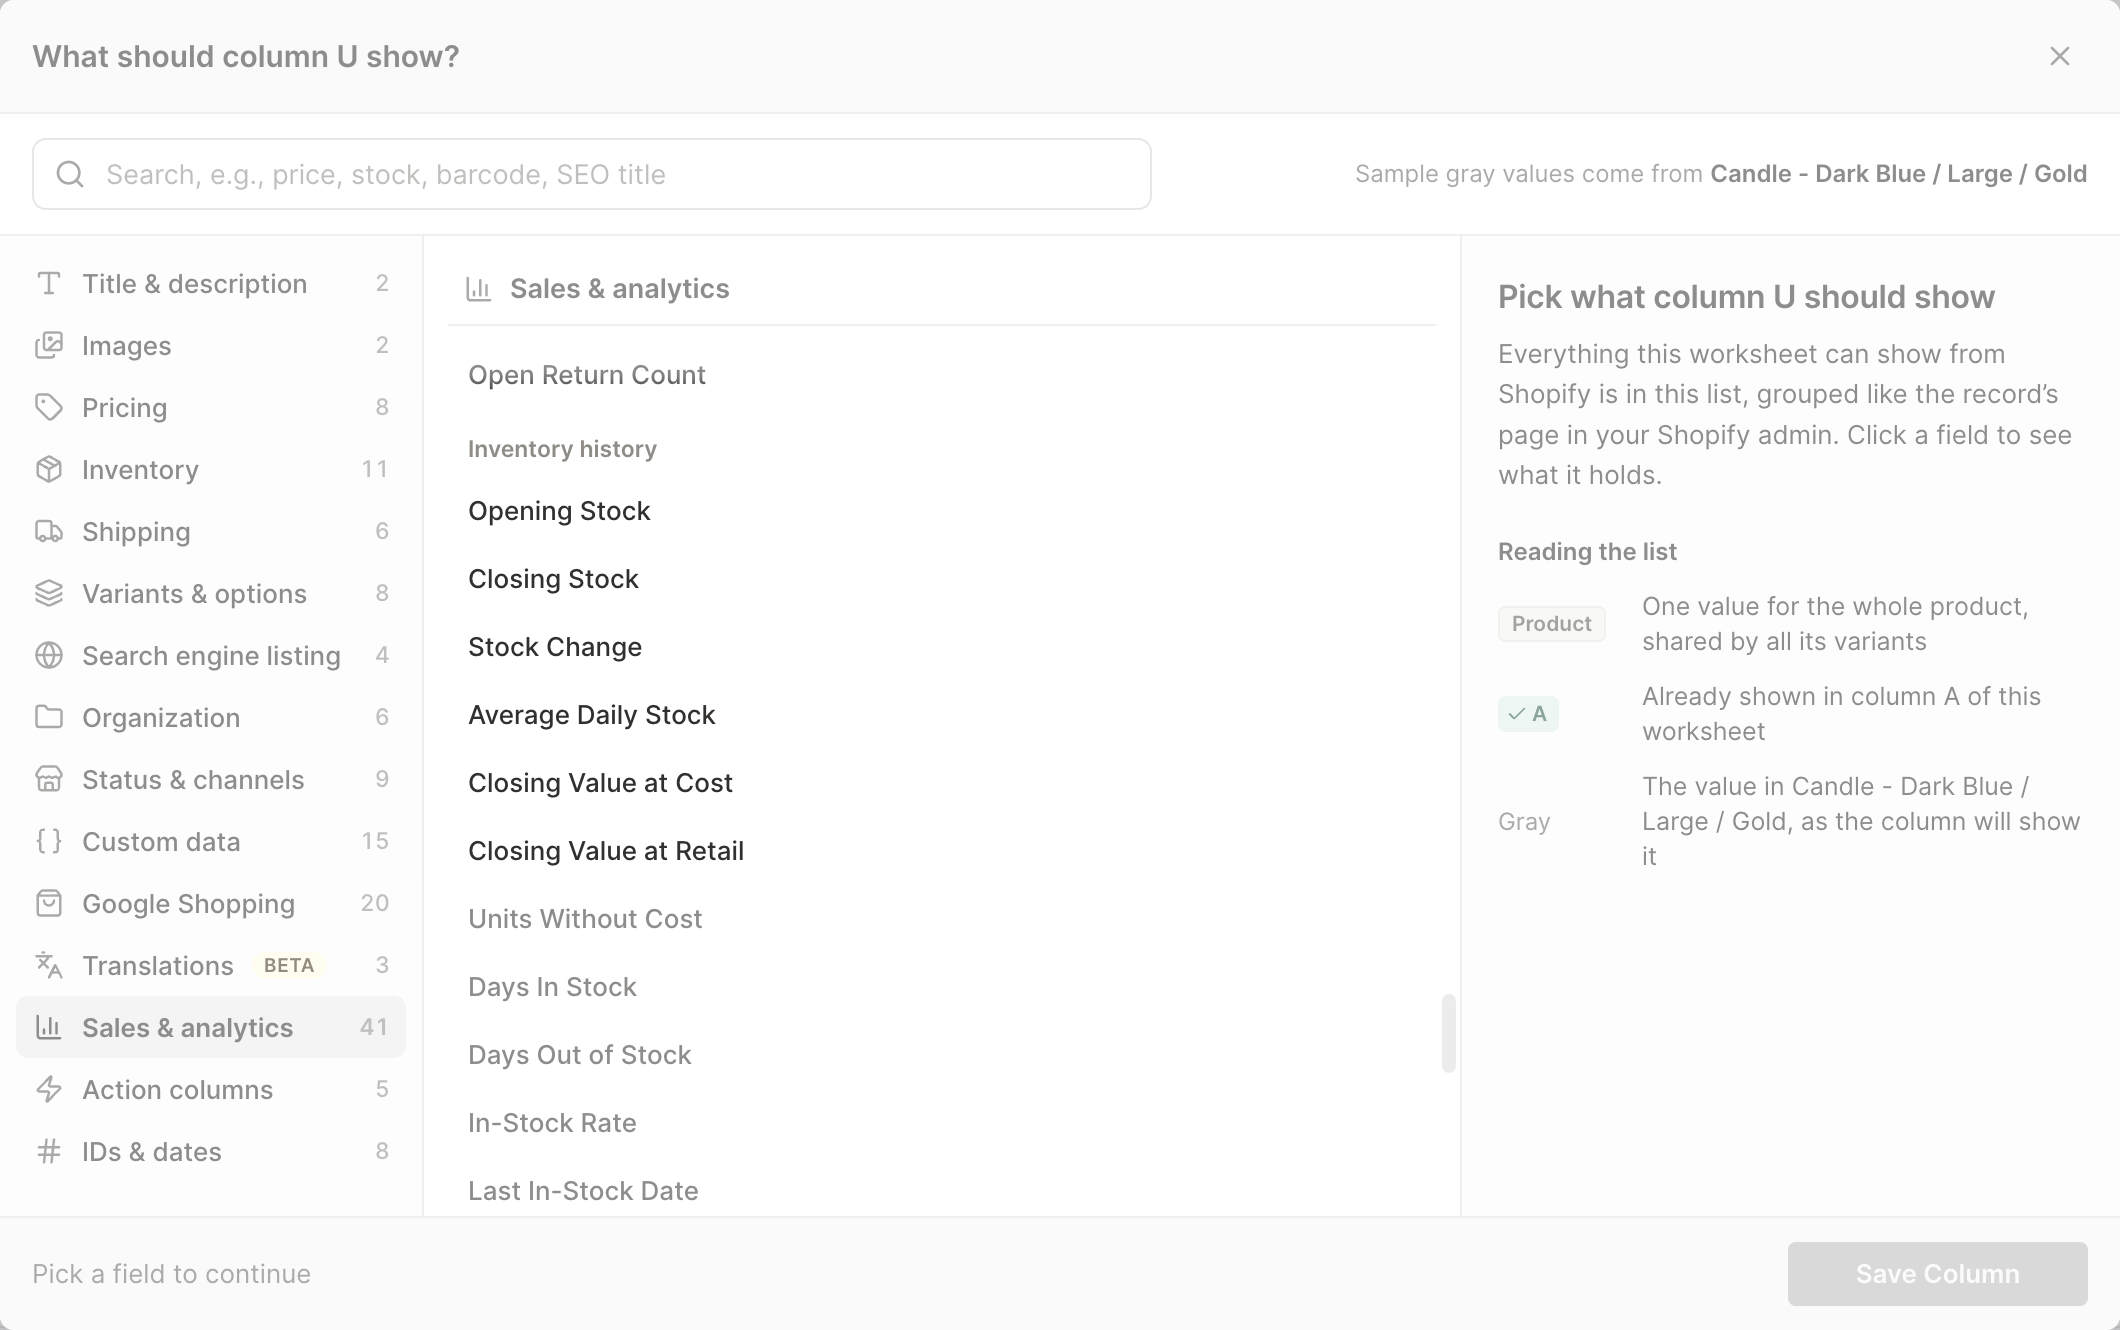
Click Sales & analytics in the list of sections on the left, then scroll down to the Inventory history group. You can also type part of the metric's name in the search box
-
Click Days of Stock Left. The metric's settings open with it already chosen under Which metric?
-
Pick the dates. Most metrics ask Over what time period?: choose Fixed dates, Rolling period, Calendar year, or Calendar month, then pick the dates. Metrics that describe a single day ask On what date? instead: choose Fixed date, Rolling date, Calendar year, or Calendar month, then pick the day
-
Under Which stock locations count, leave it as it is to count every location. To count only some, click + Add filter, choose Stock location, and pick a location. Click + Add filter again to add another one. Days of Stock Left, Estimated Lost Sales, Sell-Through Rate, and Inventory Turnover always count every location, because sales aren't split by stock location, so this step has nothing to pick for them
-
Click Save Column
For Over what time period?, choose Rolling period and Last 30 days, for example, so the pace stays current as days pass. Add Sell-Through Rate for the same period the same way, then sort the worksheet by Days of Stock Left from smallest to largest. The variants at the top run out first. See sorting Shopify data in Mixtable.
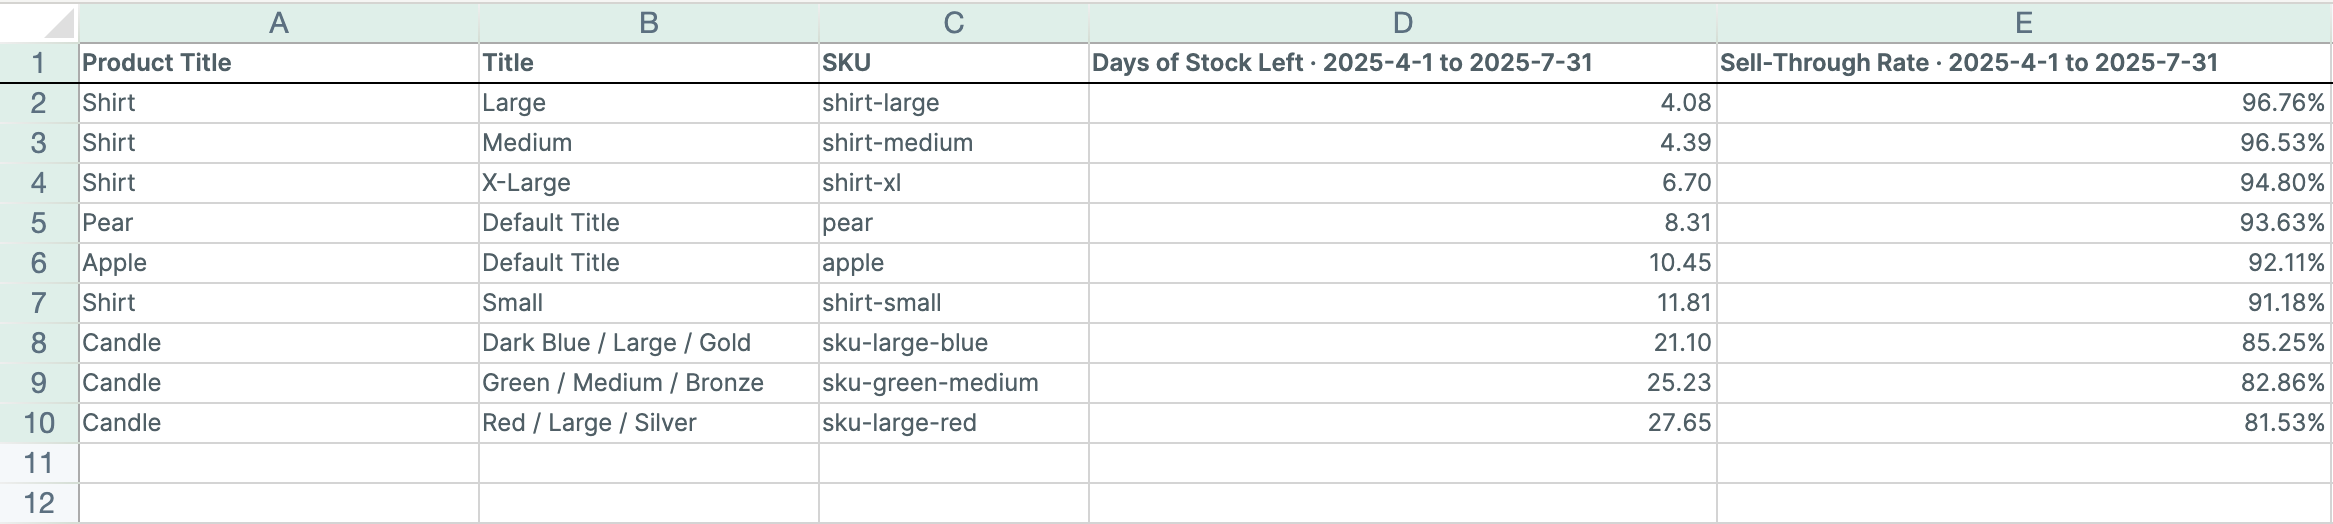
All five metrics cover a period, so they all ask Over what time period?. For the full list of date choices, see the inventory analytics guide.
Find dead stock by vendor or location
A Pivot Table worksheet totals dead stock for each vendor or stock location, so you can see where the money is tied up.
- Click the + at the end of the worksheet tabs, or choose Worksheet > Add worksheet…
- Select Reporting worksheet, then click Continue
- Under Start from scratch, select Blank pivot table, then click Continue
- Under Break down by, choose Vendor, Product type, Product category, or Product tag, or choose Location for one row per stock location
- Under Metrics, select Dead Stock Units and Dead Stock Value at Cost from the Inventory group. For a product breakdown, add Sell-Through Rate and Inventory Turnover too
- Under Time period, choose Rolling period, then Last 6 months
- Click Create Worksheet
Sort by Dead Stock Value at Cost to put the most expensive problems first. See create a Pivot Table worksheet for Shopify data.
Act on what you find
If you also use Mixtable Spreadsheet Editor, you can act on these numbers in a Shopify data worksheet: mark slow sellers down in bulk, or add them to a sale collection. Your edits go to Shopify only when you preview them and click Sync.
Next, see how often your products ran out in Shopify stockouts and in-stock rate, or what your stock is worth in Shopify stock levels and inventory value.