


Shopify Product Analytics with Mixtable
Shopify Product Analytics with Mixtable
Shopify product analytics helps you decide what to promote, replenish, improve, or discontinue. Mixtable places product fields and performance metrics together with a spreadsheet, so a sales ranking can include vendor, product type, category, status, tags, refunds, and returns instead of showing revenue alone.
Start with Product sales & return rate
The ready-made Product sales & return rate report creates a Products worksheet with:
- Product Title
- Vendor
- Product Type
- Status
- Product Category
- Net Sales
- Net Quantity Sold
- Orders Count
- Return Request Rate
- Total Refund Amount Excluding Tax
This is the quickest starting point when you want both commercial performance and after-sale problems in one Shopify product report.
- Click the + button beside the worksheet tabs
- Select Reporting worksheet, then click Continue
- Under Shopify data worksheet with analytics columns, choose Product sales & return rate
- Click Continue
- Review the selected Shopify fields, analytics columns, and row-loading rules
- Click Create Worksheet
Choose the metrics that explain product performance
A useful Shopify product scorecard usually contains several kinds of metrics.
Sales and demand
- Net Sales
- Gross Sales
- Orders Count
- Gross Quantity Sold
- Net Quantity Sold
Orders Count tells you how often a product appears in an order. Quantity metrics tell you how many units moved. A product can have a modest order count and high quantity when customers commonly buy several units at once.
Discounts and refunds
- Total Discount Amount
- Discount Code Order Count
- Allocated Discount Amount
- Total Refund Amount Excluding Tax
- Refund Count
- Percent of Orders Refunded
- Refunded Quantity
These metrics reveal products that look successful before deductions but require heavy promotions or generate unusual refund activity.
Fulfillment and returns
- Fulfillment Count
- Fulfilled Quantity
- Return Request Count
- Return Request Rate
- Return Quantity
- Return Reason Count
- Open Return Count
Return requests and refunds are different. A Shopify return can be requested before money is refunded, and a refund can occur without a physical return. Use both metric families when product quality or customer expectations are under investigation.
Add analytics to an existing Products worksheet
-
Open a Products worksheet, then select an empty column or insert a new one. Empty columns have a non-green header; a green header means the column is already linked to Shopify data
-
Click the
 button in the column header
 -
Choose Analytics
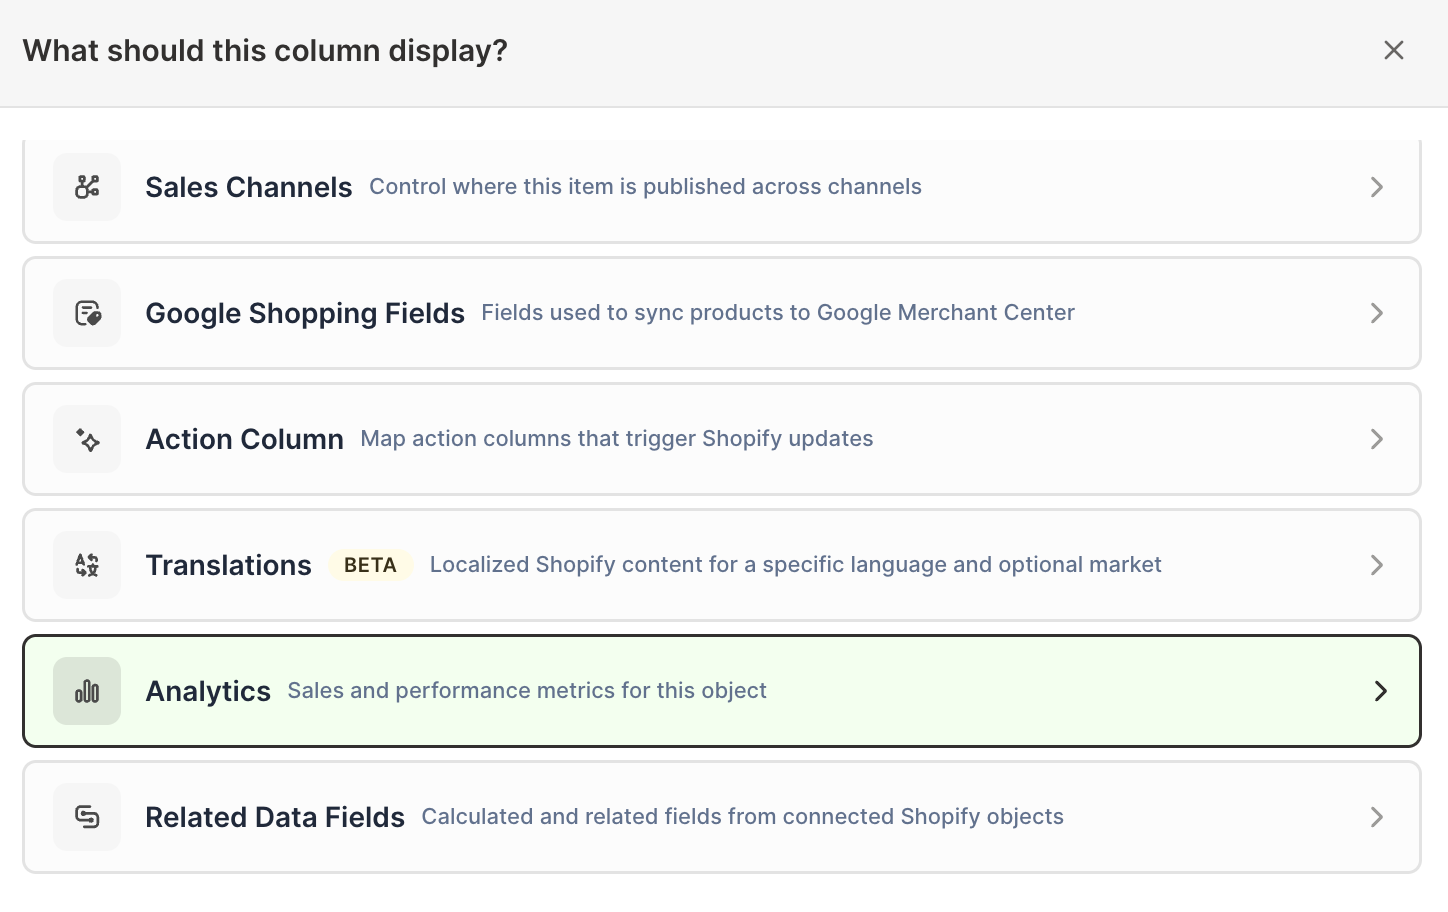
-
Under Which metric?, select the product metric you want
-
Under Over what time period?, choose All time, Fixed dates, Rolling period, Calendar year, or Calendar month
-
Under Limit which orders count, add any optional filters supported by the metric
-
Click Save Column
Add the same metric more than once to compare timeframes or audiences. For example, add Net Sales for all time and the last 90 days, then sort the recent column to find products gaining momentum.
Product analytics and variant analytics are different
A Products worksheet rolls all variants into one product row. It is best for assortment, merchandising, vendor, and category decisions.
A Product Variants worksheet keeps each SKU or option combination separate. Use it when size, color, SKU, inventory, price, cost, or margin can differ between variants. A strong product total can hide one unprofitable or high-return variant.
See Shopify Product Variant Analytics for SKU-level reporting.
Compare product groups
Use a Pivot Table worksheet when you need to move above individual products and compare:
- Vendors
- Product types
- Shopify product categories
- Product tags
- Collections
For example, an individual Products worksheet finds the products with the highest refund value. A vendor Pivot Table worksheet reveals whether those products share a supplier. A category report shows whether the issue is concentrated in one kind of merchandise.
See analyze Shopify sales by product attributes.
Track products over time
For product-by-period reporting, use the reporting templates:
These templates create repeated yearly, monthly, or seasonal analytics columns for every product.
Turn the report into decisions
Useful spreadsheet additions include:
Discount rate = Total Discount Amount / Gross SalesRefund share = Total Refund Amount / Gross SalesRecent sales share = Recent Net Sales / All-time Net Sales- A notes column for product-page, supplier, quality, or replenishment actions
- Shopify fields for inventory, status, category, vendor, tags, or product type
Sort by the metric tied to the decision. Net Sales is useful for revenue contribution, Net Quantity Sold for replenishment, Return Request Rate for product quality, and recent growth for promotion planning.
For a ready-made lifetime product scorecard, see the Product Sales Metrics template.
Manage Shopify data in a spreadsheet.
Use Mixtable to edit, sync, analyze, import, and export your Shopify store data without CSV juggling.