Customers Template
Customers Template
Mixtable’s Customer data template displays essential customer information from your Shopify store, allowing you to gain valuable insights into your customer base and make data-driven decisions. Here are some use cases:
- Identify your most valuable customers by sorting total sales and orders count and create a VIP segment for personalized retention campaigns and early access to new products.
- Analyze common patterns in Tags to understand which promotional campaigns or sources drive the most repeat purchases, helping optimize your marketing spend.
- Look for gaps between customer orders to create time-based segments (e.g., “at risk,” “dormant,” “active”) and trigger targeted win-back campaigns at the right moment.
How do you load the Customers template?
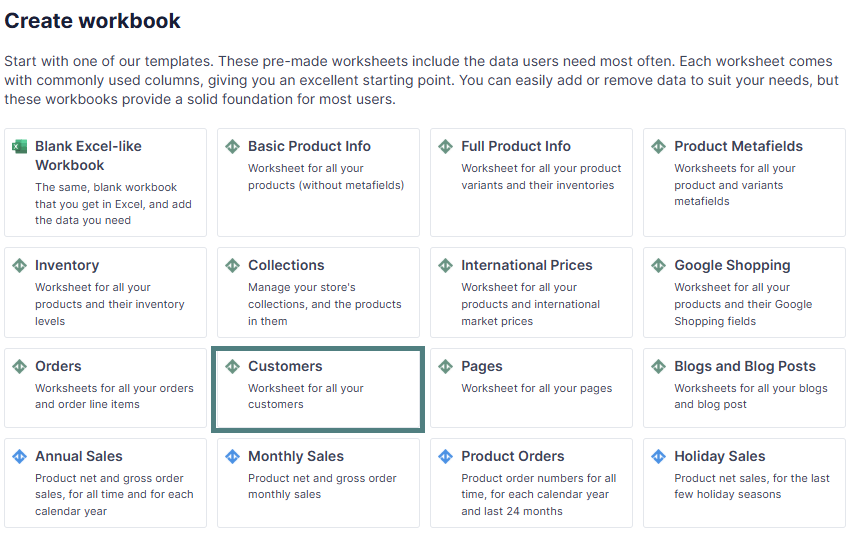
- After installing the Mixtable Spreadsheet Editor app, click the Create Spreadsheet button.
- Select the Customers pre-built template from the list that appears in the dialog.
What data is included in the Customers template?
The Customers template contains the following default columns:
- Shopify ID
- First Name
- Last Name
- Total Orders
- Tags
In addition to the default data pulled from the Customers template, you can map extra columns with analytics data per customer, such as:
Note: You would need to use the Mixtable Analytics Spreadsheet app
- Total Sales
- Total Refunds per Customer
- Segments Customers are in
- Product Categories Bought
- Orders Count
- Check other customer-related analytics
Here’s how:
How to add Total Sales data to your Customers’ spreadsheet
Having Total Sales per Customer reveals who your truly valuable customers are. This insight enables you to optimize customer acquisition costs, create targeted marketing strategies for different customer segments, identify seasonal spending patterns, and pinpoint opportunities to increase average order values through personalized promotions. If you want profit per customer rather than revenue, add the built-in Customer Lifetime Value metric beside it.
Here’s how to do it:
Note: To add Total Sales data to your Customers spreadsheet, you need to install the Mixtable Analytics Spreadsheet app.
-
To load new Shopify data, start by selecting an empty column, meaning any column with a non-green header. A green header means the column is already linked to Shopify data. Then click the
 button in the column header to open the selection window and choose the data you want to pull in.
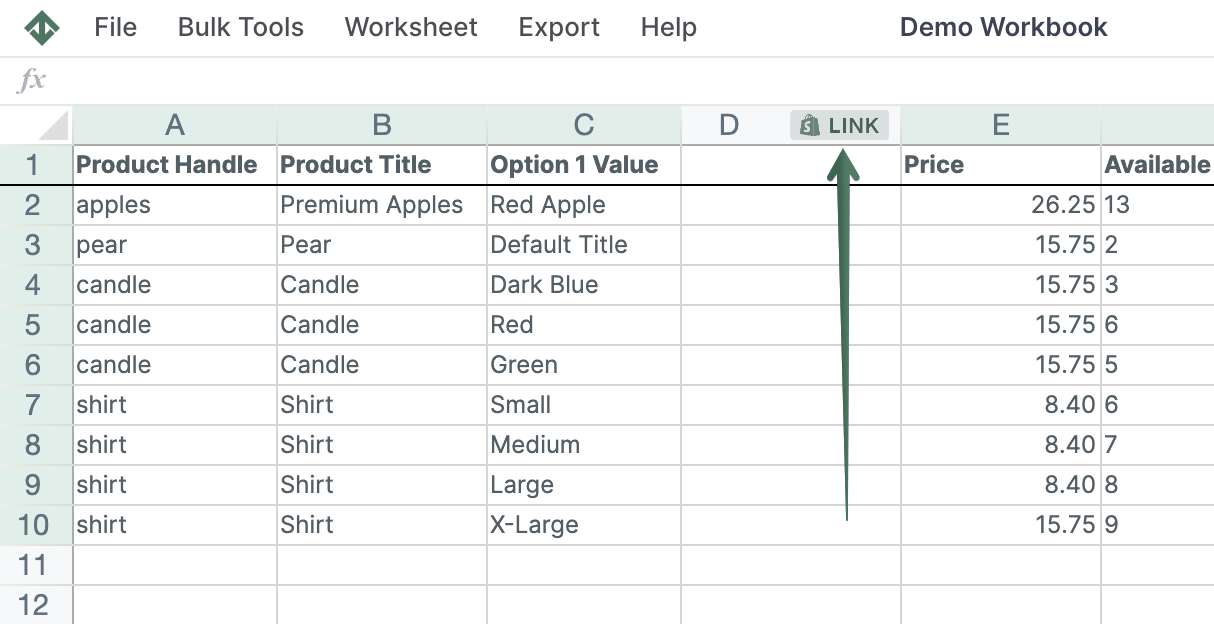
-
From the Shopify Sync Settings window, choose Analytics > Total Sales
-
Select the time range that you want the Total Sales to be calculated for. For example, with the Dynamic date range > last 30 days, you will get the sales recalculated daily as the date range window moves forward.
-
In a similar way, you can pull additional analytics data in the worksheet.
Frequently Asked Questions:
Q: Can I see which segment a customer is in?
A: Yes, you can pull data about which Segment a customer is in into the Customers template with Mixtable Analytics.
Here’s how to do it:
Note: To add Segments Customer Is In data to your Customers spreadsheet, you need to install the Mixtable Analytics Spreadsheet app.
-
To load new Shopify data, start by selecting an empty column, meaning any column with a non-green header. A green header means the column is already linked to Shopify data. Then click the
button in the column header to open the selection window and choose the data you want to pull in. -
From the Shopify Sync Settings window, choose Analytics > Segments Customer Is In.
Now, you can see all the segments in the spreadsheet cell, separated by commas. For example:
- Customers who have purchased at least once,
- Customers who have purchased more than once,
- Purchased: Man
Q: Can I delete customers in bulk?
A: Yes, from the Mixtable Customers template, you can filter customers by certain criteria and remove the ones you need to. Here’s how to do it:
- Select the rows for the customer(s) you’d like to delete, just like in Excel - by clicking on the row header and dragging the mouse to cover additional row headers.
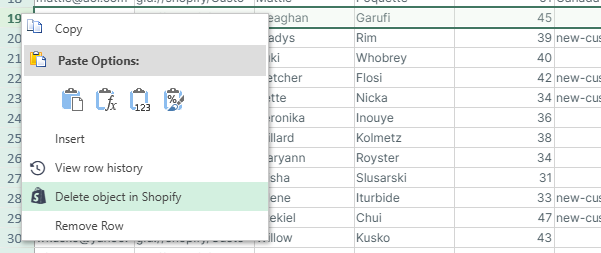
- Then, right-click on one of the selected row headers (the row header shows the row number).
- In the menu that opens, select the Delete object in Shopify option.
You’ll now see a dialog showing up confirming if you want to permanently delete the selected customers from your store. Once you confirm, Mixtable will notify Shopify, asking it to delete the customers. Once the deletion is done, the customer’s data will be cleared from your worksheet.
If you want to remove the empty rows afterward, click the Worksheet menu and select Remove Empty Rows. You can also select the empty row headers and delete the rows manually.
You're ready!
Mixtable is an online spreadsheet designed to sync data with Shopify. It looks, feels, and behaves like Excel (including formulas), but runs in your browser. With Mixtable you can:
- Bulk add products to collections, edit metafields, add or remove tags;
- Change product prices, including international prices, and review price history;
- Manage customers with a spreadsheet CRM for Shopify;
- Use Excel features like sort ascending or descending, find-replace, filter, and more.
Best of all, you can sync changes back to Shopify with a single click. Find out more about the Mixtable suite of products here.
Manage Shopify data in a spreadsheet.
Use Mixtable to edit, sync, analyze, import, and export your Shopify store data without CSV juggling.