
Shopify Net Sales Analytics
 Analytics Spreadsheet Updated October 8, 2026
 On this page
Net Sales is what your store actually kept from merchandise: product sales after discounts and returns, with tax excluded. It is the number most Shopify merchants use as their headline sales figure.
How Shopify Net Sales is calculated
Net Sales = Gross Sales - Discounts - Returns
Tax, shipping, duties, and additional fees are all excluded, which is what makes Net Sales a merchandise figure rather than an order total. It does not subtract product cost either, so it measures revenue rather than profit.
Why Net Sales is the number to rank by
Gross Sales makes everything look good. A product can top your bestseller list until you notice that a big share of its revenue was discounted away, or refunded a week later. Net Sales removes both, so the ranking reflects money you held on to.
Put Net Sales beside your Shopify data and you can:
- Find the products, variants, and collections that genuinely carry your revenue
- Spot vendors or product types that only look strong before discounts
- Compare customer segments by what they are worth, not how many people are in them
- Tell whether a good month came from real demand or from a heavy promotion
Note: Net Sales is not profit. It does not subtract product cost, marketing spend, payment fees, or other operating costs. For a cost-aware view, see Orders Net Profit.
Add Net Sales to a Shopify data worksheet
Analytics columns put Net Sales right beside the Shopify data you already view or edit, so you can see performance without leaving the sheet you work in.
-
Open a supported Shopify data worksheet
-
Click + Shopify data in the header row of an empty column, or choose Column > Add Shopify data… from the menu bar. The field picker opens
-
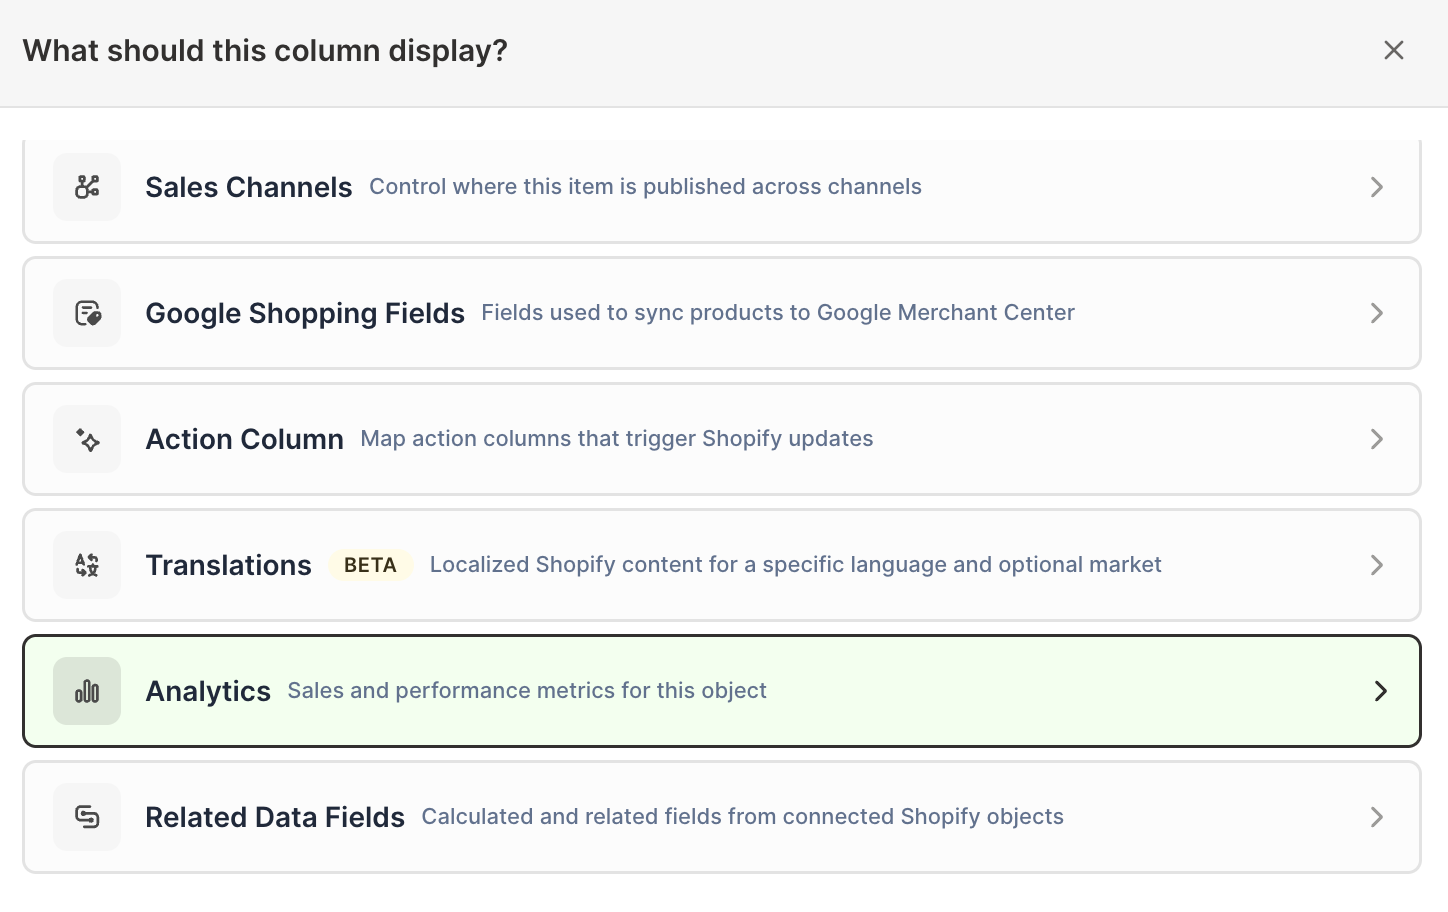
Click Sales & analytics in the list of sections on the left, or type the metric's name in the search box
-
Click Net Sales. The metric's settings open with it already chosen under Which metric?
-
Under Over what time period?, choose All time, Fixed dates, Rolling period, Calendar year, or Calendar month
-
Under Limit which orders count, add any optional filters supported by the metric
-
Click Save Column
Filters are where this gets interesting. Depending on the worksheet, you can narrow the calculation by Shopify customer segment, customer country, parent discount campaign, fulfillment status, order source, order type, company, company location, and first-touch or last-touch attribution values. That lets one column answer a specific question, such as how much a product earned from a single campaign.

Compare Net Sales with a Pivot Table worksheet
A Pivot Table worksheet turns Net Sales into a leaderboard. Instead of one row per product, you get one row per vendor, category, or segment, which is the fastest way to see where your revenue is concentrated.
- Click the + at the end of the worksheet tabs, or choose Worksheet > Add worksheet…
- Select Reporting worksheet, then click Continue
- Select a ready-made Pivot Table report, or choose Blank pivot table, then click Continue
- Choose vendor, product type, product category, product tag, market, or customer segment under Break down by
- Add Net Sales and any supporting metrics under Metrics
- Choose the timeframe under Time period
- Click Create Worksheet
Add Gross Sales, Total Discount Amount, Total Refund Amount Excluding Tax, Orders Count, and Net Quantity Sold alongside it, plus Average Order Value on Market or customer segment rows (rows that group products, such as vendors, show N/A for it). Together they explain why a group’s Net Sales came in where it did, rather than just showing the total.
The builder creates its columns without filters. To narrow a column with the filters described above, add it once the worksheet exists: click + Analytics data in the header row of an empty column, choose Net Sales under Which metric?, pick the time period, add filters under Limit which orders count, and click Save Column.
Track Net Sales by day, week, month, or year
Totals tell you where you stand. Time Series worksheets tell you which way you are heading, which is what you need before committing to a vendor, a category, or a seasonal buy.
- Click the + at the end of the worksheet tabs, select Reporting worksheet, and click Continue
- Choose a ready-made Time Series report, or select Blank time series, then click Continue
- Under Break down by, choose store, vendor, product type, market, customer segment, or marketing channel
- Choose Net Sales under Measure when the report asks for one (with Store rows, select it under Metrics)
- Under Time periods, choose By day, By week, By month, or By year, then choose how many recent periods to include next to for the last
- Click Create Worksheet
Ready-made starting points include Store sales and orders by month, Vendor net sales by year, Product type net sales by month, Customer segment net sales by month, and Marketing channel net sales by month.
Because the result is a normal worksheet, you can add your own growth or variance formulas beside the generated columns, then export the whole thing to Excel or CSV.
Net Sales and Gross Sales answer different questions
Use Gross Sales when you want original demand, before deductions. Use Net Sales when you want the merchandise revenue that survived discounts and returns. Reporting both, side by side, shows you exactly how much of your top line your promotions and returns are consuming.