


Create a Time Series Worksheet for Shopify Data
Create a Time Series Worksheet for Shopify Data
A Time Series worksheet tracks Shopify performance across recent months or years. It turns a total into a trend, which helps you spot seasonality, changing customer behavior, vendor momentum, market growth, and marketing-channel shifts.
In this worksheet type, time periods live in the columns. The rows define either the store metrics you want to follow or the Shopify groups you want to compare.
Choose the Time Series layout
The layout changes depending on the breakdown.
Store breakdown
When you choose Store, each selected metric becomes a row. Recent months or years become the columns. Store metrics available in the builder include:
- Net Sales
- Gross Sales
- Orders Count
- Average Order Value
- Net Quantity Sold
- Total Refund Amount Excluding Tax
- Refund Count
- Total Discount Amount
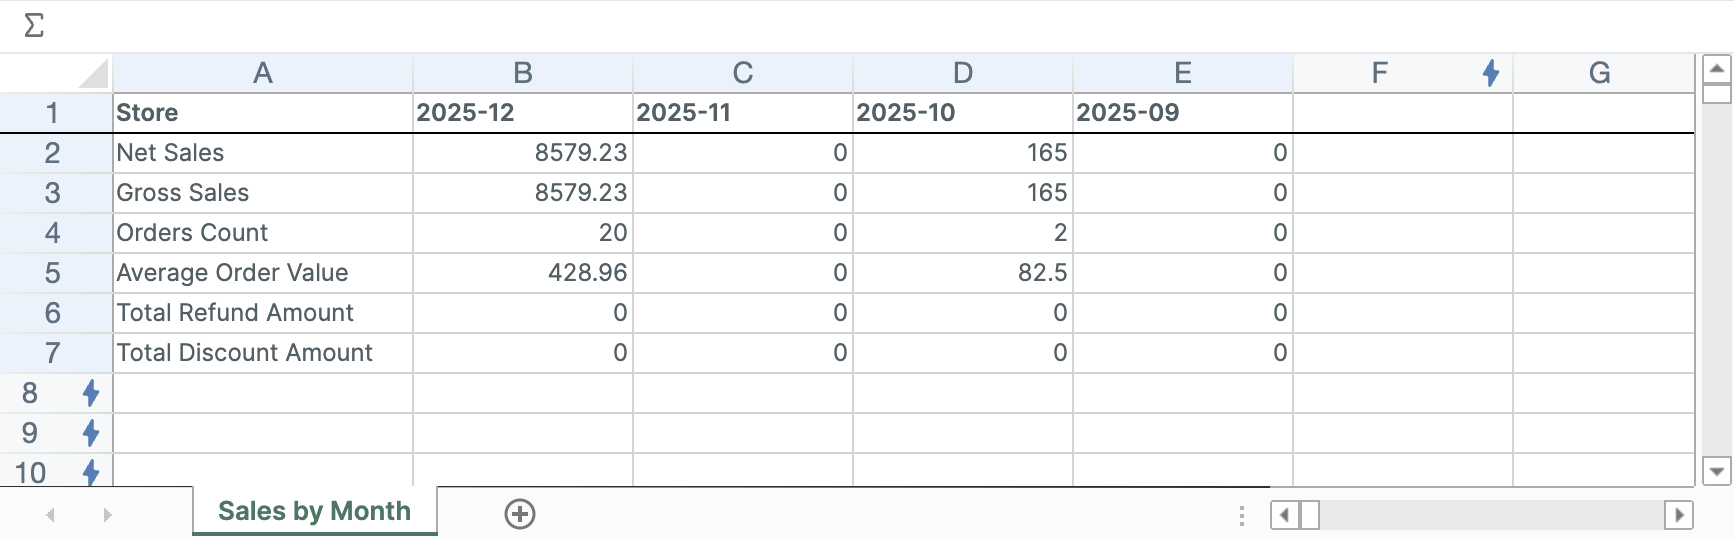
This is the best layout for a monthly or yearly Shopify performance summary. Each row keeps its metric across every column, so reading down a single month gives you the whole picture for that month.
Business-dimension breakdown
When you choose a business dimension, each group becomes a row and one selected metric is measured across the time-period columns. Available breakdowns include:
- Vendor
- Product type
- Shopify Market
- Customer segment
- Marketing channel
The builder offers Net Sales, Gross Sales, Orders Count, Net Quantity Sold, Total Refund Amount Excluding Tax, and Average Order Value as the single measure for these grouped reports.
The Marketing channel breakdown uses the last-touch marketing source associated with the Shopify customer journey.
These breakdowns generate the rows for you, but they are not the only rows available. You can add your own rows with conditions you define, which is covered under add a row after creation below.
Start with a ready-made Time Series report
Mixtable includes:
- Vendor net sales by year
- Store sales and orders by month
- Product type net sales by month
- Customer segment net sales by month
- Marketing channel net sales by month
These are starting points. You can change the breakdown, measure, monthly or yearly setting, and number of periods before creating the worksheet.
Create a Time Series worksheet
- Click the + button beside the worksheet tabs
- Select Reporting worksheet, then click Continue
- Under Time series, select a ready-made report, or choose Blank time series under Start from scratch
- Click Continue
- Under Break down by, choose Store or a business dimension
- Under Metrics or Measure, choose what the rows should calculate
- Under Time periods, choose By month or By year
- Choose how many recent periods to include
- Review the sample preview
- Click Create Worksheet
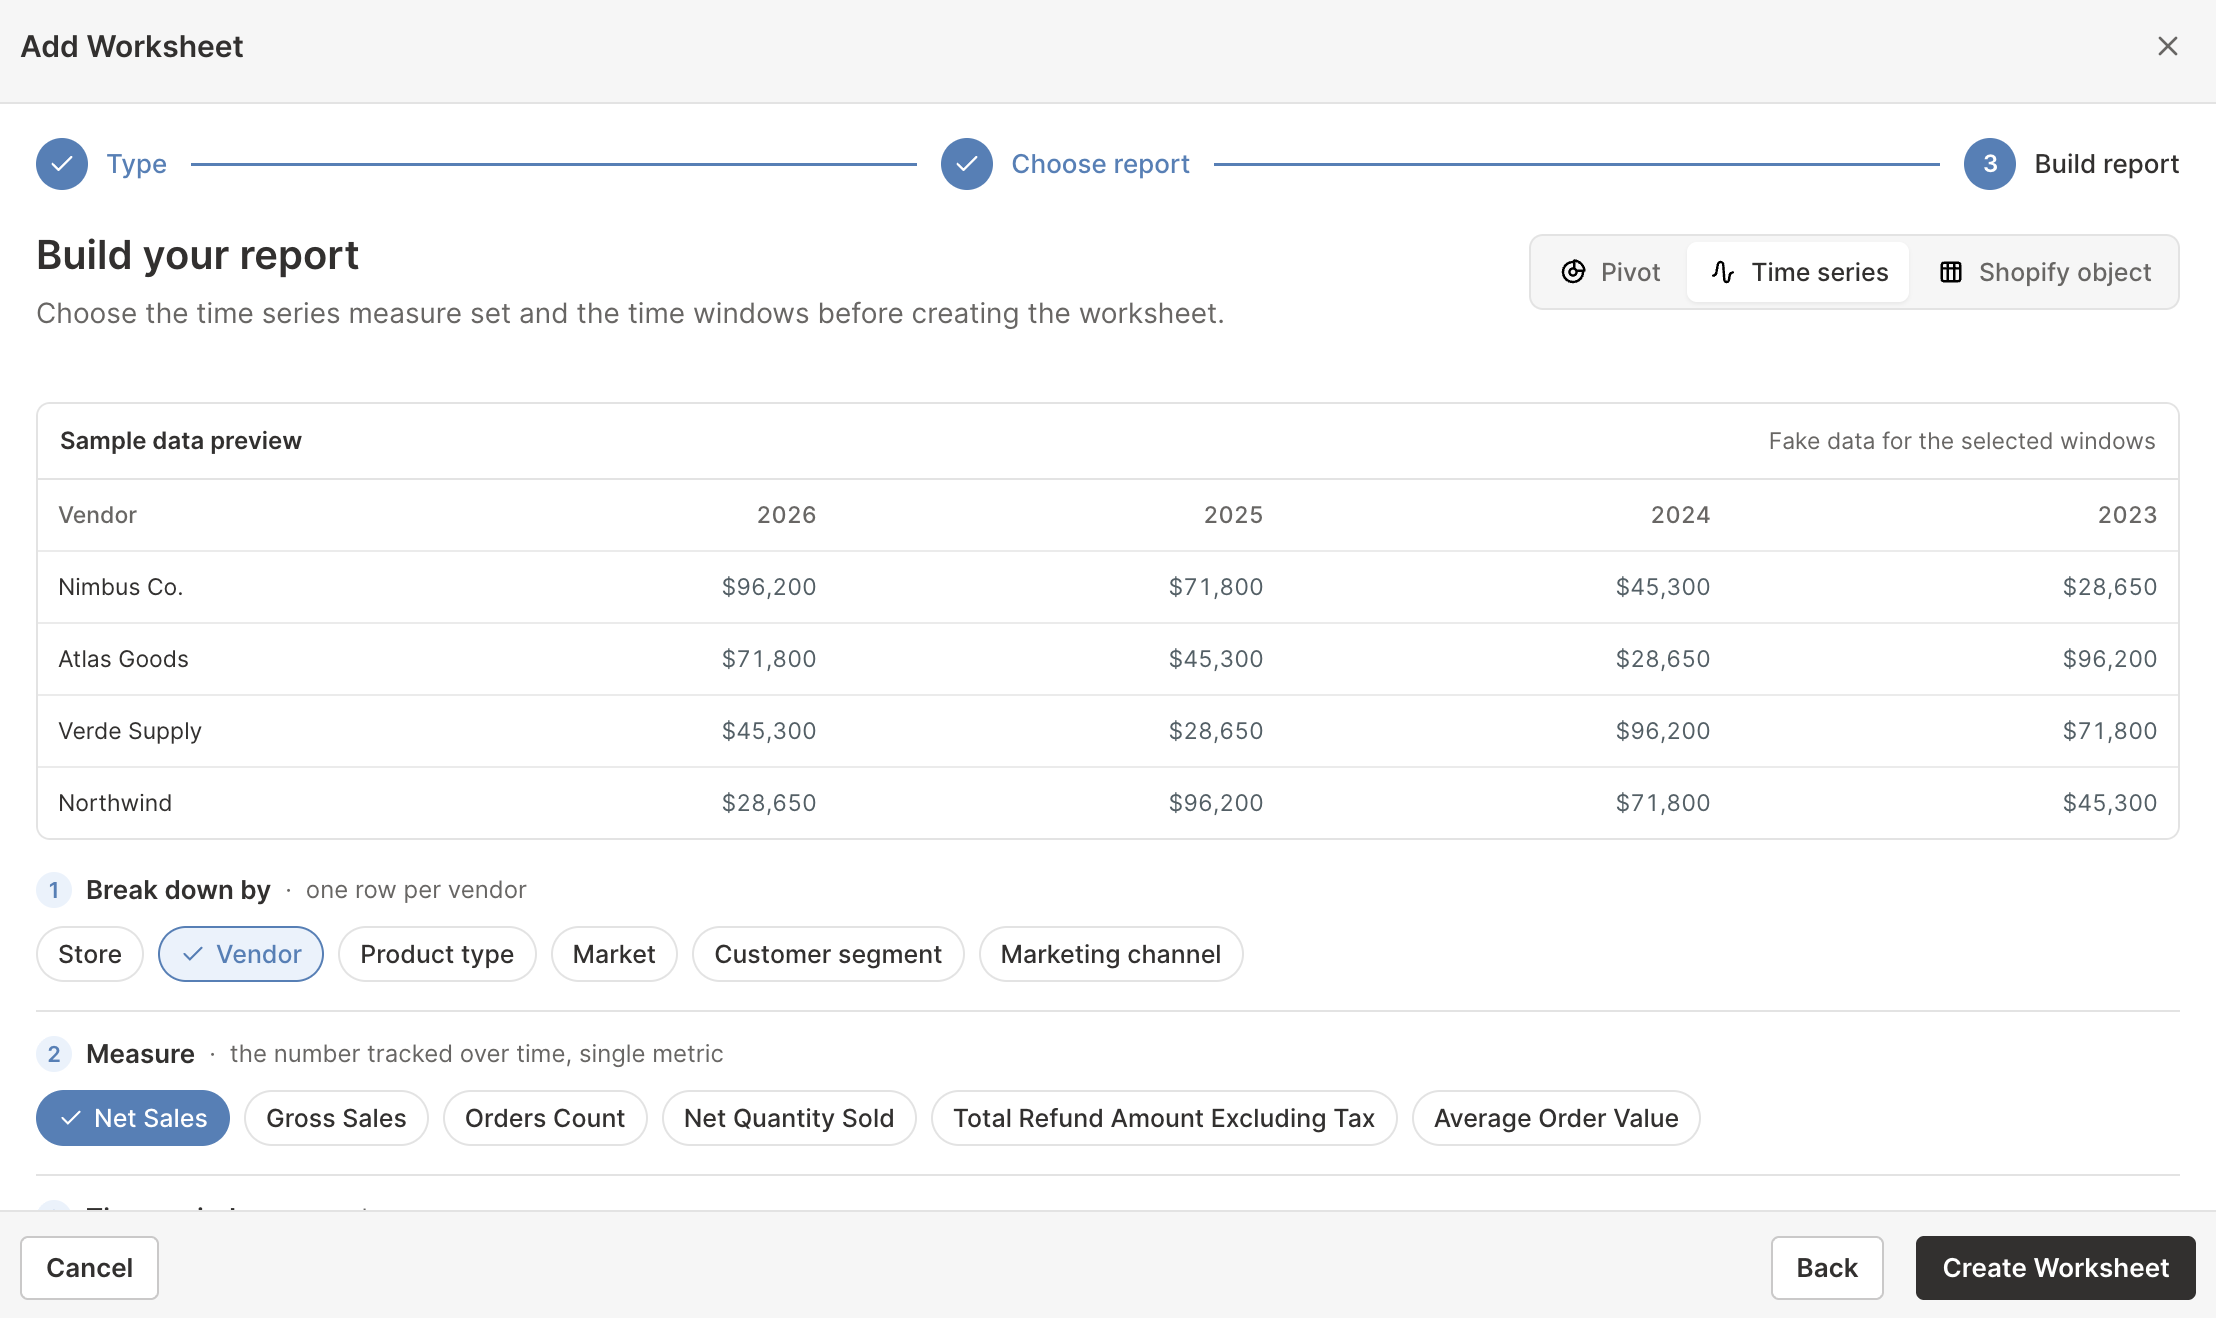
Mixtable can create up to 36 recent monthly columns or up to 10 recent yearly columns. Choose enough history to reveal the pattern without making the worksheet harder to scan.
Pick months or years
Use monthly columns when you need to see:
- Seasonal peaks and slow periods
- Campaign or promotion effects
- Recent changes in refunds or discounts
- Whether a vendor or Market is gaining momentum
Use yearly columns when you need to see:
- Long-term growth
- Structural changes in the product mix
- Vendor relationships over several buying cycles
- Whether customer segments are becoming more or less valuable
A yearly view can hide short spikes. A monthly view can make normal seasonality look alarming. When the decision matters, create both views or add both monthly and yearly worksheets.
Add a row after creation
In a Time Series worksheet, each row defines the metric, the Shopify objects it measures, and any order filters.
Like every Reporting worksheet, its headers and bolt buttons are blue rather than the green used on Shopify data worksheets.
- Click the
 button in an empty row header to open Analytics Row Settings
 - Under What do you want to analyze?, choose Products, Product Variants, Collections, Customers, or Store
- Under Which metric?, select the metric for the row
- Under Which products should this row include?, keep All products for every record, or choose Only matching products and add the conditions. The step adapts to the object you picked
- Under Refine which orders count, add optional order filters
- Under Row label, keep the automatic name or type your own
- Click Save Row
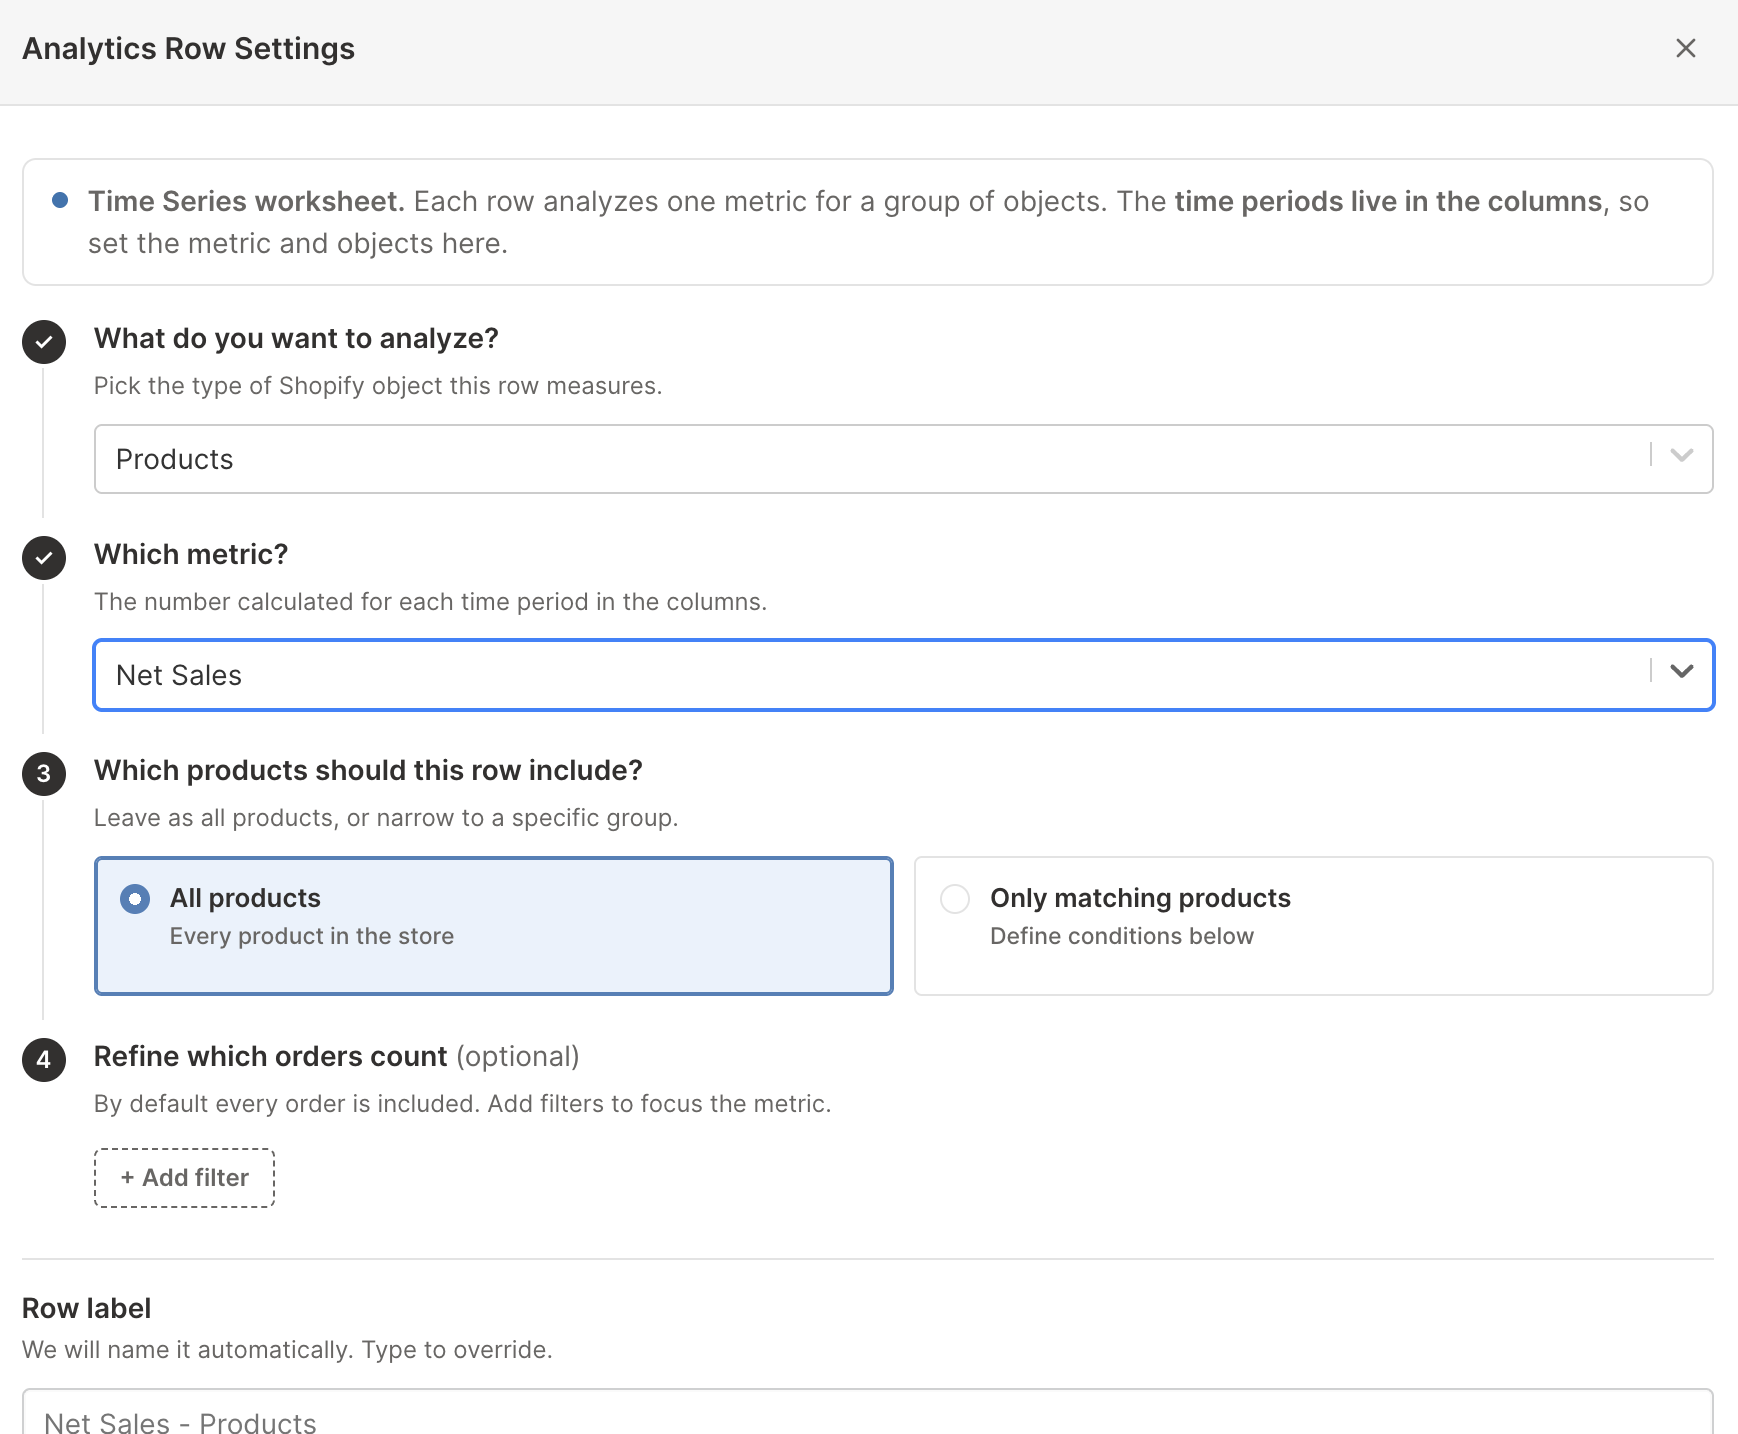
Step 5 is where a row stops being a store-wide total. The filter menu offers the order filters supported by the metric, such as customer segment, customer country, discounts, repeat customers, and fulfillment status.
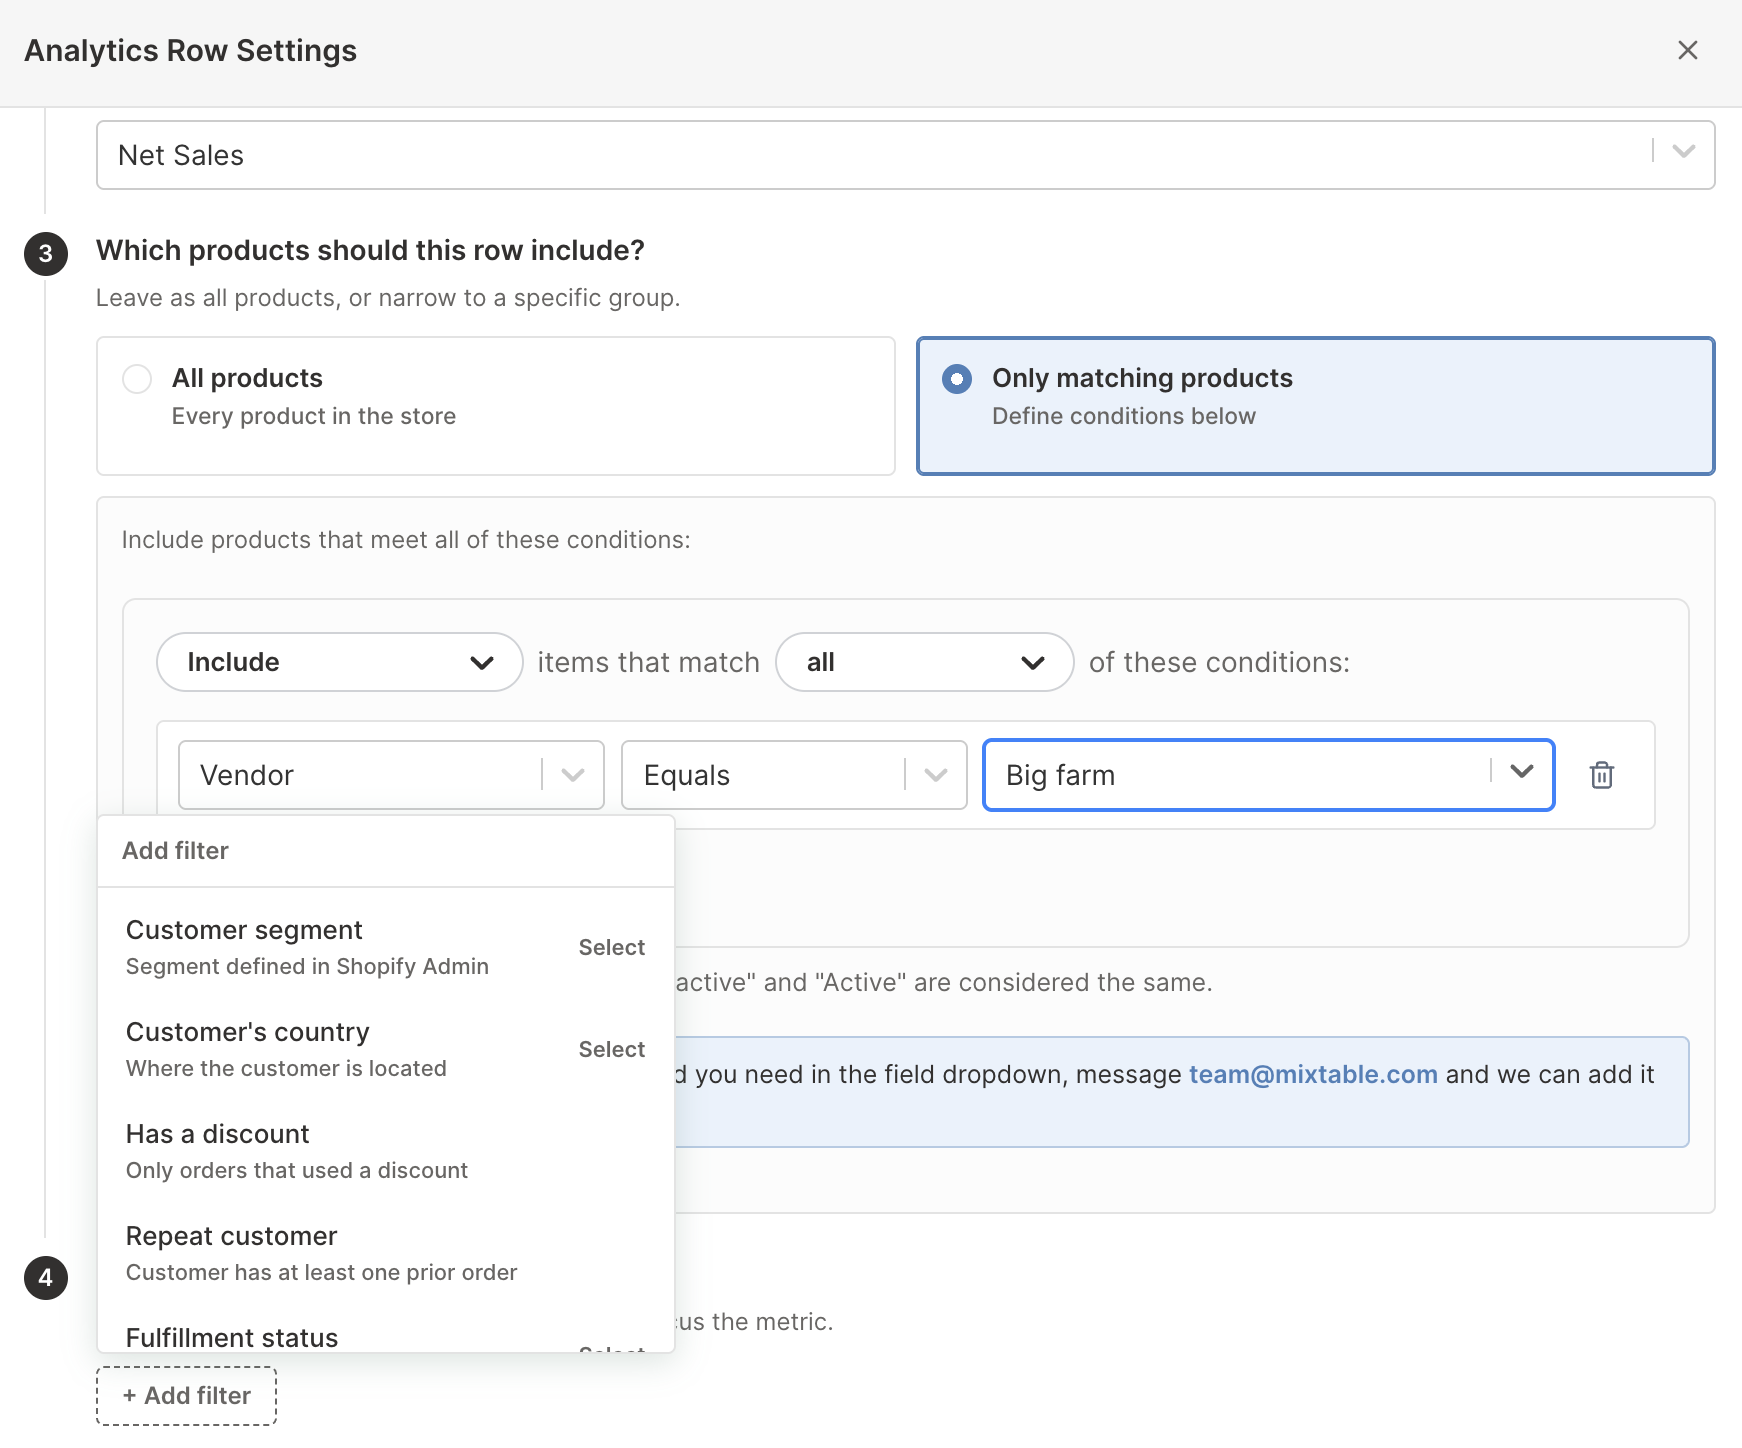
Because each row carries its own metric, object group, and filters, a single worksheet can track things a breakdown could never produce side by side:
- Net Sales for one vendor’s tagged products, beside that vendor’s other products
- Orders Count for customers above a given lifetime spend
- Net Sales for variants above a cost threshold, beside those below it
- Refund totals for one collection, beside store-wide refunds
Give each row a clear label, since the labels are the only thing distinguishing rows that use the same metric.
Note: A Store row always covers the full Shopify store, so it does not accept record conditions. Use the row’s order filters to narrow it.
Add a time-period column
Each Time Series column applies its date range to every configured row.
- Select an empty column, or insert a new column
- Click the button in the column header
- Under Time period for this column, select All time, Fixed date range, Calendar year, or Calendar month
- Set the dates for the option you chose
- Click Save Column
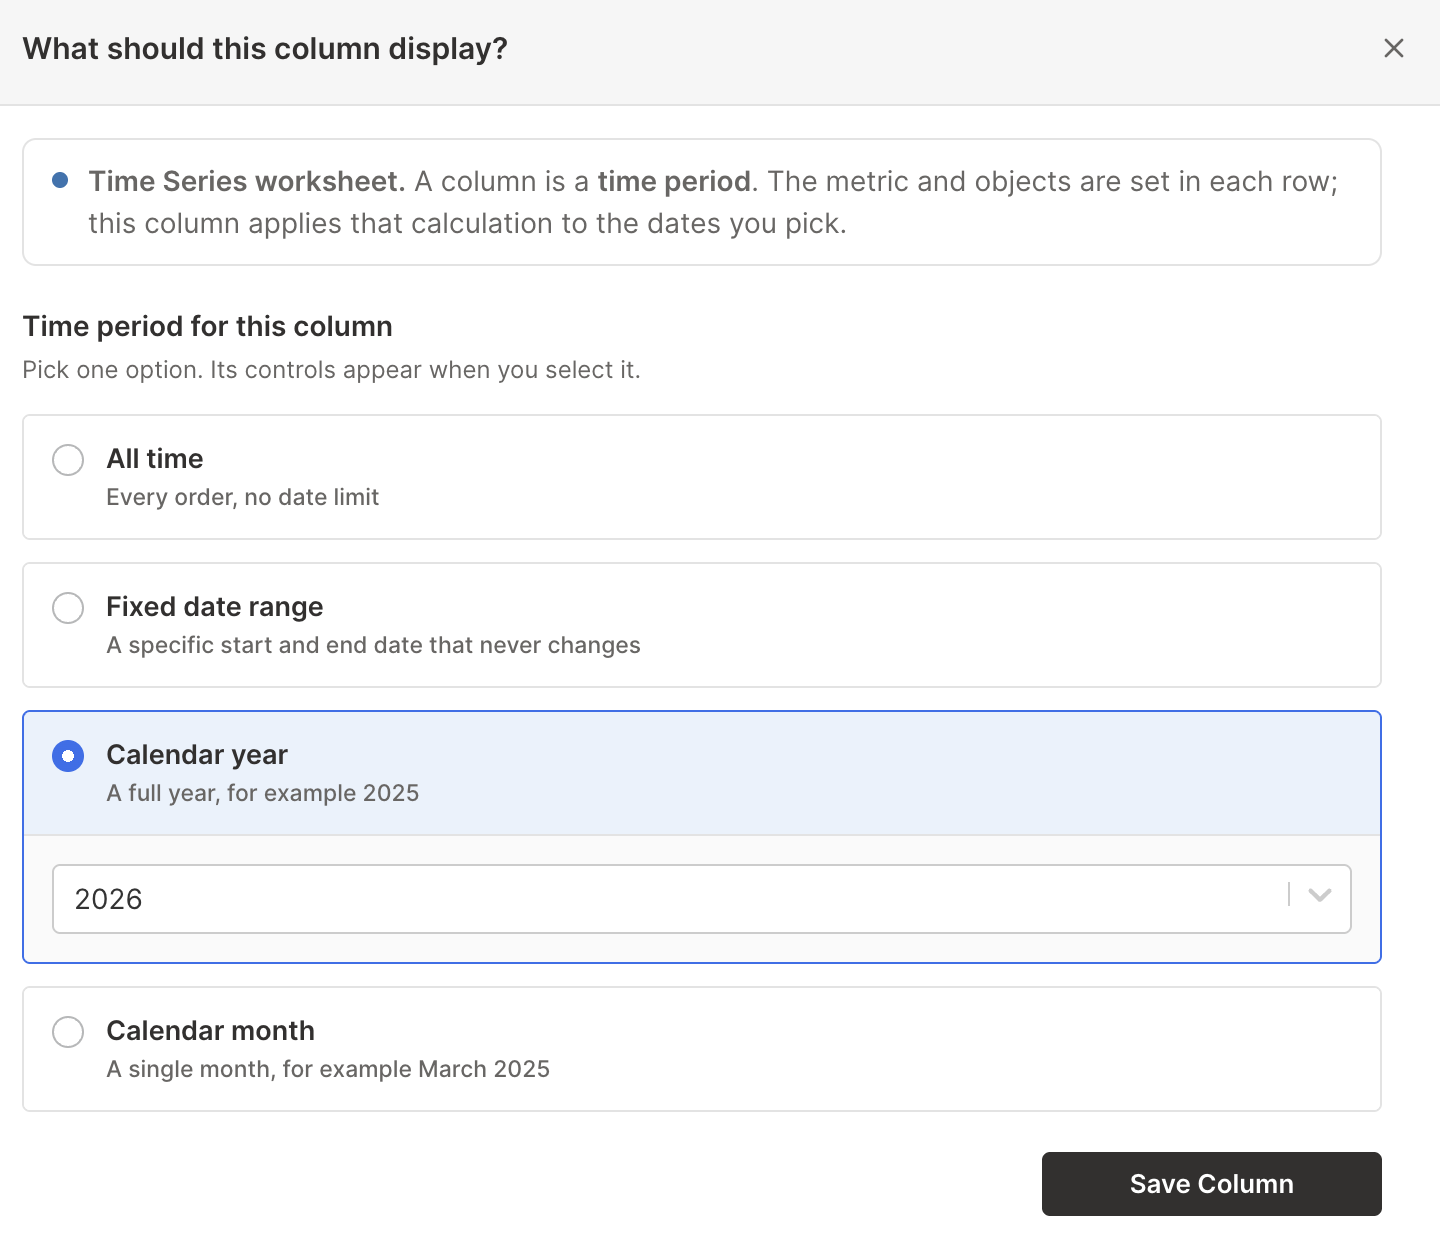
A Time Series column carries only the dates. The metric and the Shopify records come from each row, which is why these columns offer calendar periods rather than the rolling periods available on a Pivot Table or analytics column.
Use clear labels when adding custom periods, especially when a column does not follow the same monthly or yearly sequence as the original report.
Compare trends responsibly
Before acting on a change, check the metric beside at least one supporting measure:
- Net Sales rising while Orders Count stays flat usually means larger baskets
- Gross Sales rising while Net Sales stays flat can mean heavier discounts or refunds
- Net Quantity Sold rising faster than sales can mean lower-priced products are taking a larger share
- Refund Amount rising with sales may be normal, while a faster refund increase deserves investigation
- Marketing-channel sales can move because attribution coverage changed, not only because the channel changed
Add formula columns for month-over-month or year-over-year growth, or copy the report into an exported Excel file for additional modeling.
For a ranked comparison over one timeframe, use a Pivot Table worksheet.
Manage Shopify data in a spreadsheet.
Use Mixtable to edit, sync, analyze, import, and export your Shopify store data without CSV juggling.