
Shopify Stock Levels and Inventory Value
 Analytics Spreadsheet Updated October 6, 2026
 On this page
- What a day’s stock means
- Opening Stock and Closing Stock
- Stock Change
- Average Daily Stock
- Closing Value at Cost and Closing Value at Retail
- Units Without Cost
- Where you can use these metrics
- Add a stock level or inventory value column
- Build a month-end inventory value report
- These are past days, not a live count
How much stock did you have at the end of last month, and what was it worth? Your Shopify admin shows today’s numbers. These seven inventory metrics in Mixtable Analytics Spreadsheet answer it for the day you choose, for each variant, product, or collection, or totaled by vendor, product type, stock location, or for the whole store.
| Metric | What it shows |
|---|---|
| Opening Stock | Units in stock at the start of the day |
| Closing Stock | Units in stock at the end of the day |
| Stock Change | Closing Stock minus Opening Stock over a period |
| Average Daily Stock | The average number of units in stock per day over a period |
| Closing Value at Cost | What the closing stock cost you, at each variant’s cost per item |
| Closing Value at Retail | What the closing stock would sell for at each variant’s price |
| Units Without Cost | Units in the closing stock that have no cost per item |
They are part of Mixtable’s 18 inventory metrics. For where the numbers come from, how the history downloads, and the date rules every inventory metric follows, start with the Shopify inventory analytics guide.
What a day’s stock means
Every metric on this page starts from the same number: a variant’s stock at the end of a day. That is the quantity Shopify shows as Available, added up over the stock locations you count. Units committed to orders and incoming units aren’t part of it. Shopify keeps this history from October 1, 2023, so that’s the earliest day you can pick, and yesterday is the latest.
Mixtable doesn’t round negative stock up to zero when it counts units. If a variant is oversold by 2 units at one location and has 5 at another, its stock that day is 3.
Opening Stock and Closing Stock
Closing Stock = the stock at the end of the day
Opening Stock = the stock at the start of the day, which is the Closing Stock of the day before
Both describe a single day, so their column settings ask On what date? rather than for a period. Pick Rolling date and End of last month for a month-end stock count that moves forward on its own every month.
In a Pivot Table or Time Series worksheet, where every column covers a period, Closing Stock is the stock at the end of the period’s last day and Opening Stock is the stock at the start of its first day.
Opening Stock starts on October 2, 2023, because it needs the closing stock of the day before, and Shopify’s history starts on October 1.
Stock Change
Stock Change = Closing Stock − Opening Stock
Stock Change covers a period. A positive number means stock built up over the period, and a negative number means it ran down.
It is the net result of everything that moved stock: sales, restocked returns, received purchase orders, transfers, and manual adjustments. It doesn’t tell you which of them caused the change. To see the sales side on its own, put a Net Quantity Sold column for the same period beside it.
Like Opening Stock, Stock Change starts on October 2, 2023, so its fixed-dates shortcut reads Since October 2, 2023.
Average Daily Stock
Average Daily Stock = the sum of each day’s Closing Stock ÷ the number of days in the period
Average Daily Stock smooths out deliveries and sell-downs into one number for the period. For example, over a 30-day period, a variant that held 20 units for 10 days and none for the other 20 has an Average Daily Stock of 20 × 10 ÷ 30 = 6.67.
- Days the variant had no stock record, for example before it was created, count as zero but still count as days in the period
- On a product, collection, or report row, it is the group’s total stock averaged per day, not an average of each variant’s average
Average Daily Stock is also what Inventory Turnover divides sales by.
Closing Value at Cost and Closing Value at Retail
Closing Value at Cost = the sum of units in stock at the end of the day × each variant’s cost per item
Closing Value at Retail = the sum of units in stock at the end of the day × each variant’s price
For example, a variant with 40 units at your warehouse and 10 at your shop, a cost per item of $12, and a price of $45 has a Closing Value at Cost of 50 × $12 = $600.00 and a Closing Value at Retail of 50 × $45 = $2,250.00.
A few details decide what goes into these values:
- Cost and price on that day: Mixtable uses each variant’s cost per item and price as they stood at the end of the chosen day. Mixtable keeps its own record of those changes, so for days before it started recording, it uses the earliest values it has
- Price: the variant’s price in Shopify, not its compare-at price or a market price
- Negative stock: each location is valued on its own, and a location with negative stock counts as zero. Overselling at one location doesn’t lower the value of stock held at another, so the units behind these values can be higher than Closing Stock
- Missing cost: units whose variant has no cost per item are left out of Closing Value at Cost. A cost of 0 counts as a recorded cost, so those units are valued at zero rather than left out
The values are in your store’s currency.
Units Without Cost
Units Without Cost = units in stock at the end of the day whose variant has no cost per item
These are exactly the units Closing Value at Cost leaves out. Like the value metrics, it values each location on its own and counts negative stock as zero.
Put it beside Closing Value at Cost to see how complete that value is. If it isn’t zero, add an analytics column for it to a Products (with variants) worksheet and sort by it to find the variants to fix first. The cost per item in Shopify guide explains how to fill in costs in bulk.

A cost you add counts from the moment you add it. Earlier days keep the value they had, so a month-end value from before the fix still leaves those units out.
Where you can use these metrics
All seven work everywhere inventory metrics do:
- Analytics columns on Products (with variants), Products (no variants), and Collections worksheets
- Pivot Table and Time Series rows for a vendor, product type, product category, or product tag, Store rows, and Location rows
On a group of products, each metric adds up the variants in the group. A product adds up its current variants, and a collection adds up the products it holds today. Store totals include variants you have deleted since, so last year’s closing value doesn’t change when you delete a product. A product can sit in several collections or carry several tags, so those rows can count the same stock more than once.
Add a stock level or inventory value column
An analytics column puts stock and its value beside the Shopify fields you already work with, such as SKU, vendor, and cost per item.
-
Open a Products (with variants), Products (no variants), or Collections worksheet. To add one, click the + at the end of the worksheet tabs, or choose Worksheet > Add worksheet…
-
Click + Shopify data in the header row of an empty column, or choose Column > Add Shopify data… from the menu bar. The field picker opens
-
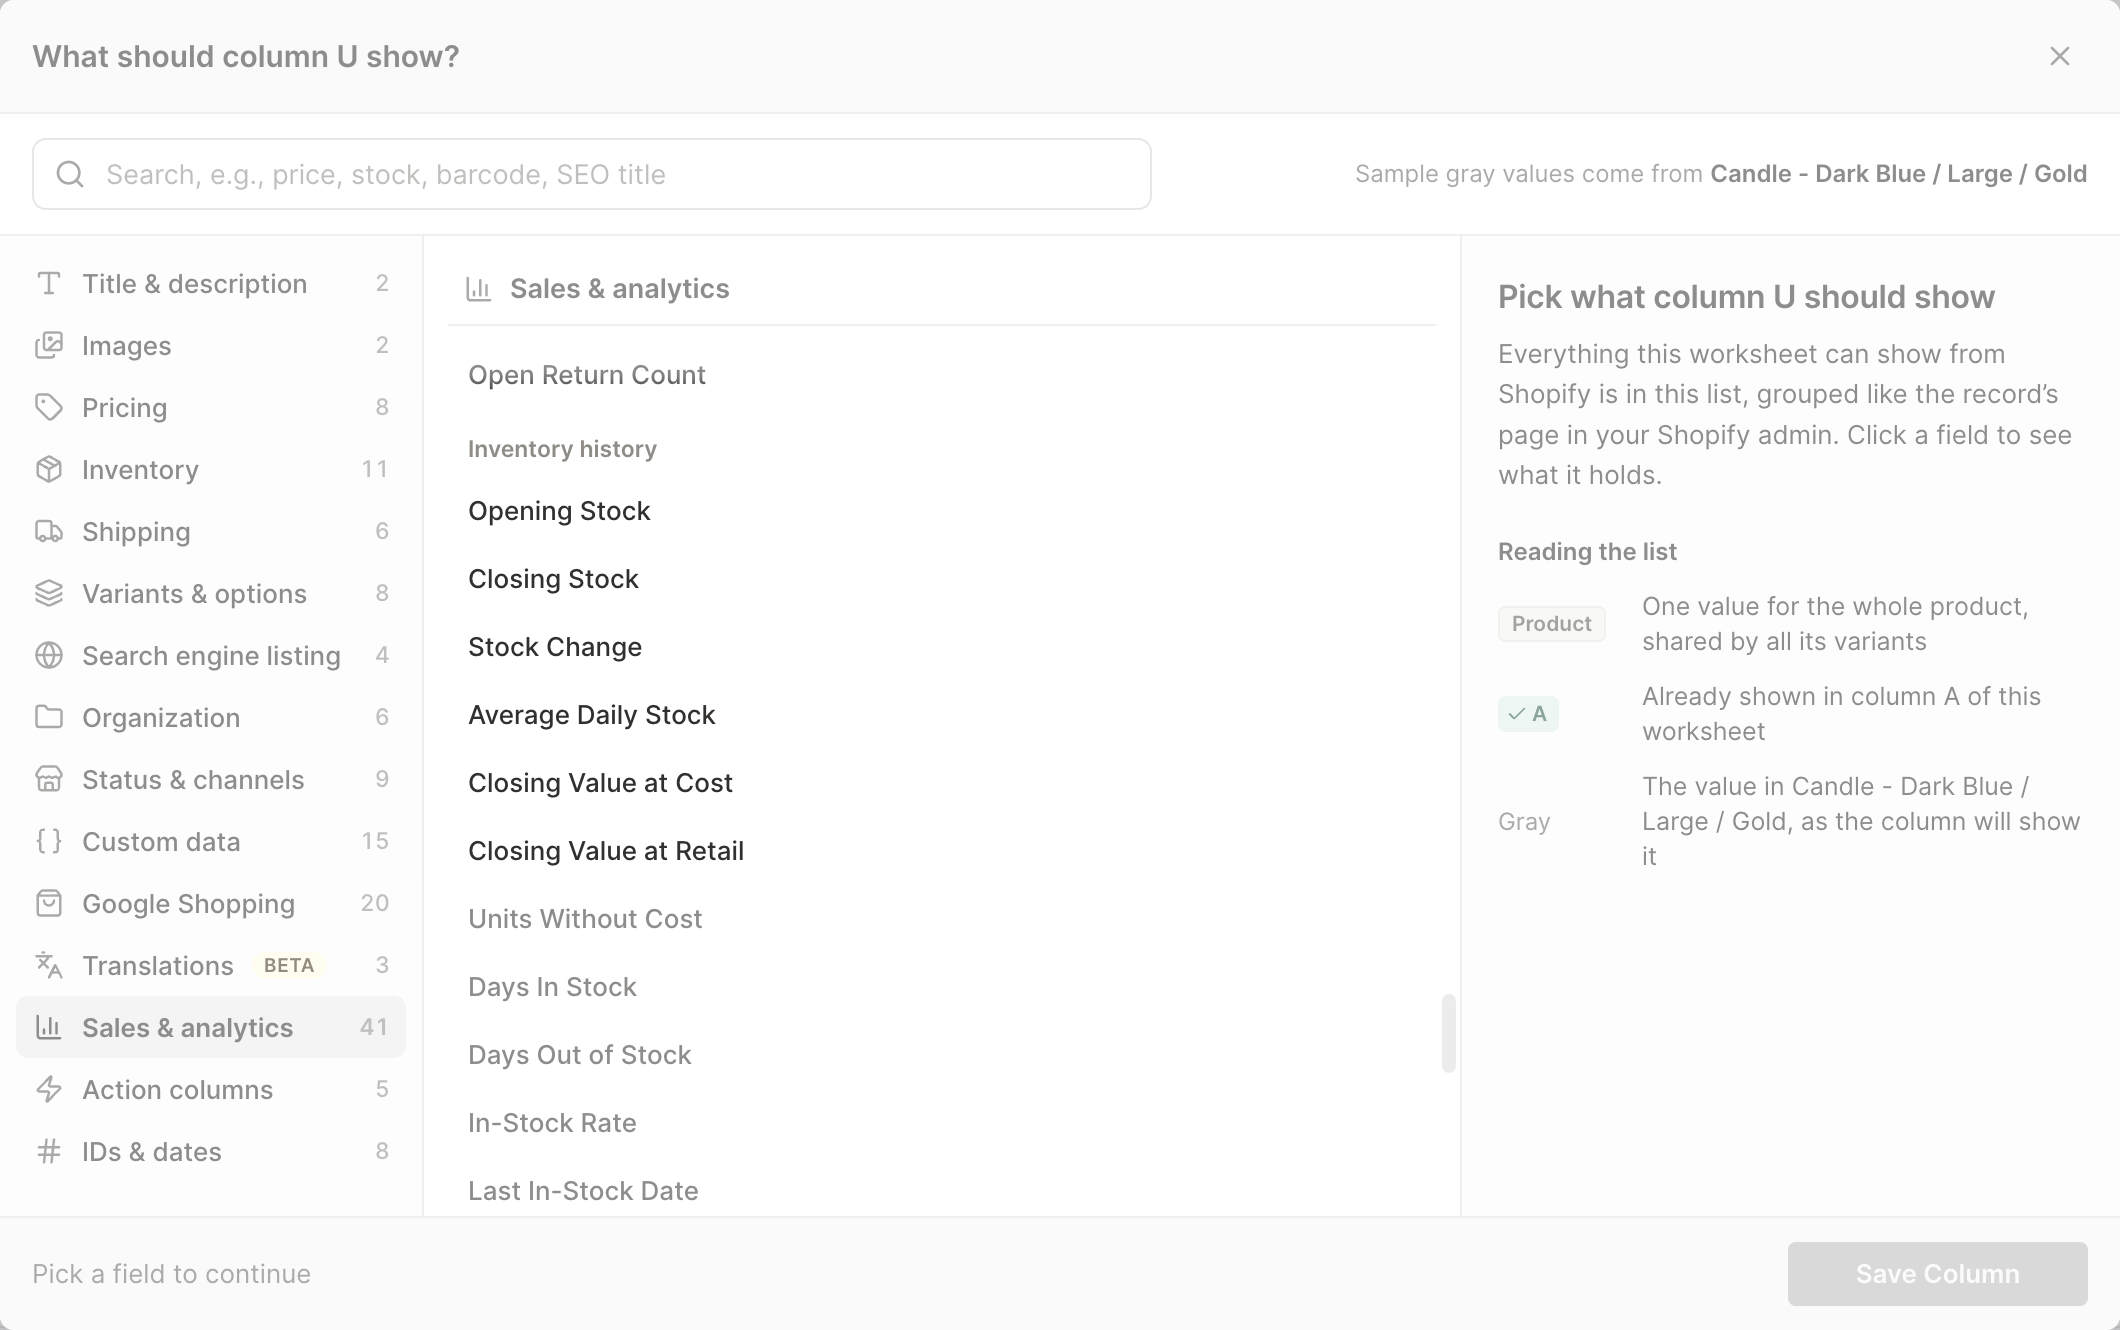
Click Sales & analytics in the list of sections on the left, then scroll down to the Inventory history group. You can also type part of the metric's name in the search box
-
Click Closing Stock or another metric on this page. The metric's settings open with it already chosen under Which metric?
-
Pick the dates. Most metrics ask Over what time period?: choose Fixed dates, Rolling period, Calendar year, or Calendar month, then pick the dates. Metrics that describe a single day ask On what date? instead: choose Fixed date, Rolling date, Calendar year, or Calendar month, then pick the day
-
Under Which stock locations count, leave it as it is to count every location. To count only some, click + Add filter, choose Stock location, and pick a location. Click + Add filter again to add another one. Days of Stock Left, Estimated Lost Sales, Sell-Through Rate, and Inventory Turnover always count every location, because sales aren't split by stock location, so this step has nothing to pick for them
-
Click Save Column
Opening Stock, Closing Stock, Closing Value at Cost, Closing Value at Retail, and Units Without Cost ask On what date?. Stock Change and Average Daily Stock ask Over what time period?. For the full list of date choices, see the inventory analytics guide.
Build a month-end inventory value report
A Pivot Table worksheet gives each vendor, product type, or stock location its own row, which makes a month-end stock valuation a one-step report.
- Click the + at the end of the worksheet tabs, or choose Worksheet > Add worksheet…
- Select Reporting worksheet, then click Continue
- Under Start from scratch, select Blank pivot table, then click Continue
- Under Break down by, choose Vendor, Product type, Product category, or Product tag for one row per group of products, or Location for one row per stock location
- Under Metrics, select Closing Stock, Closing Value at Cost, Closing Value at Retail, and Units Without Cost from the Inventory group
- Under Time period, choose Calendar month, then pick the month
- Click Create Worksheet
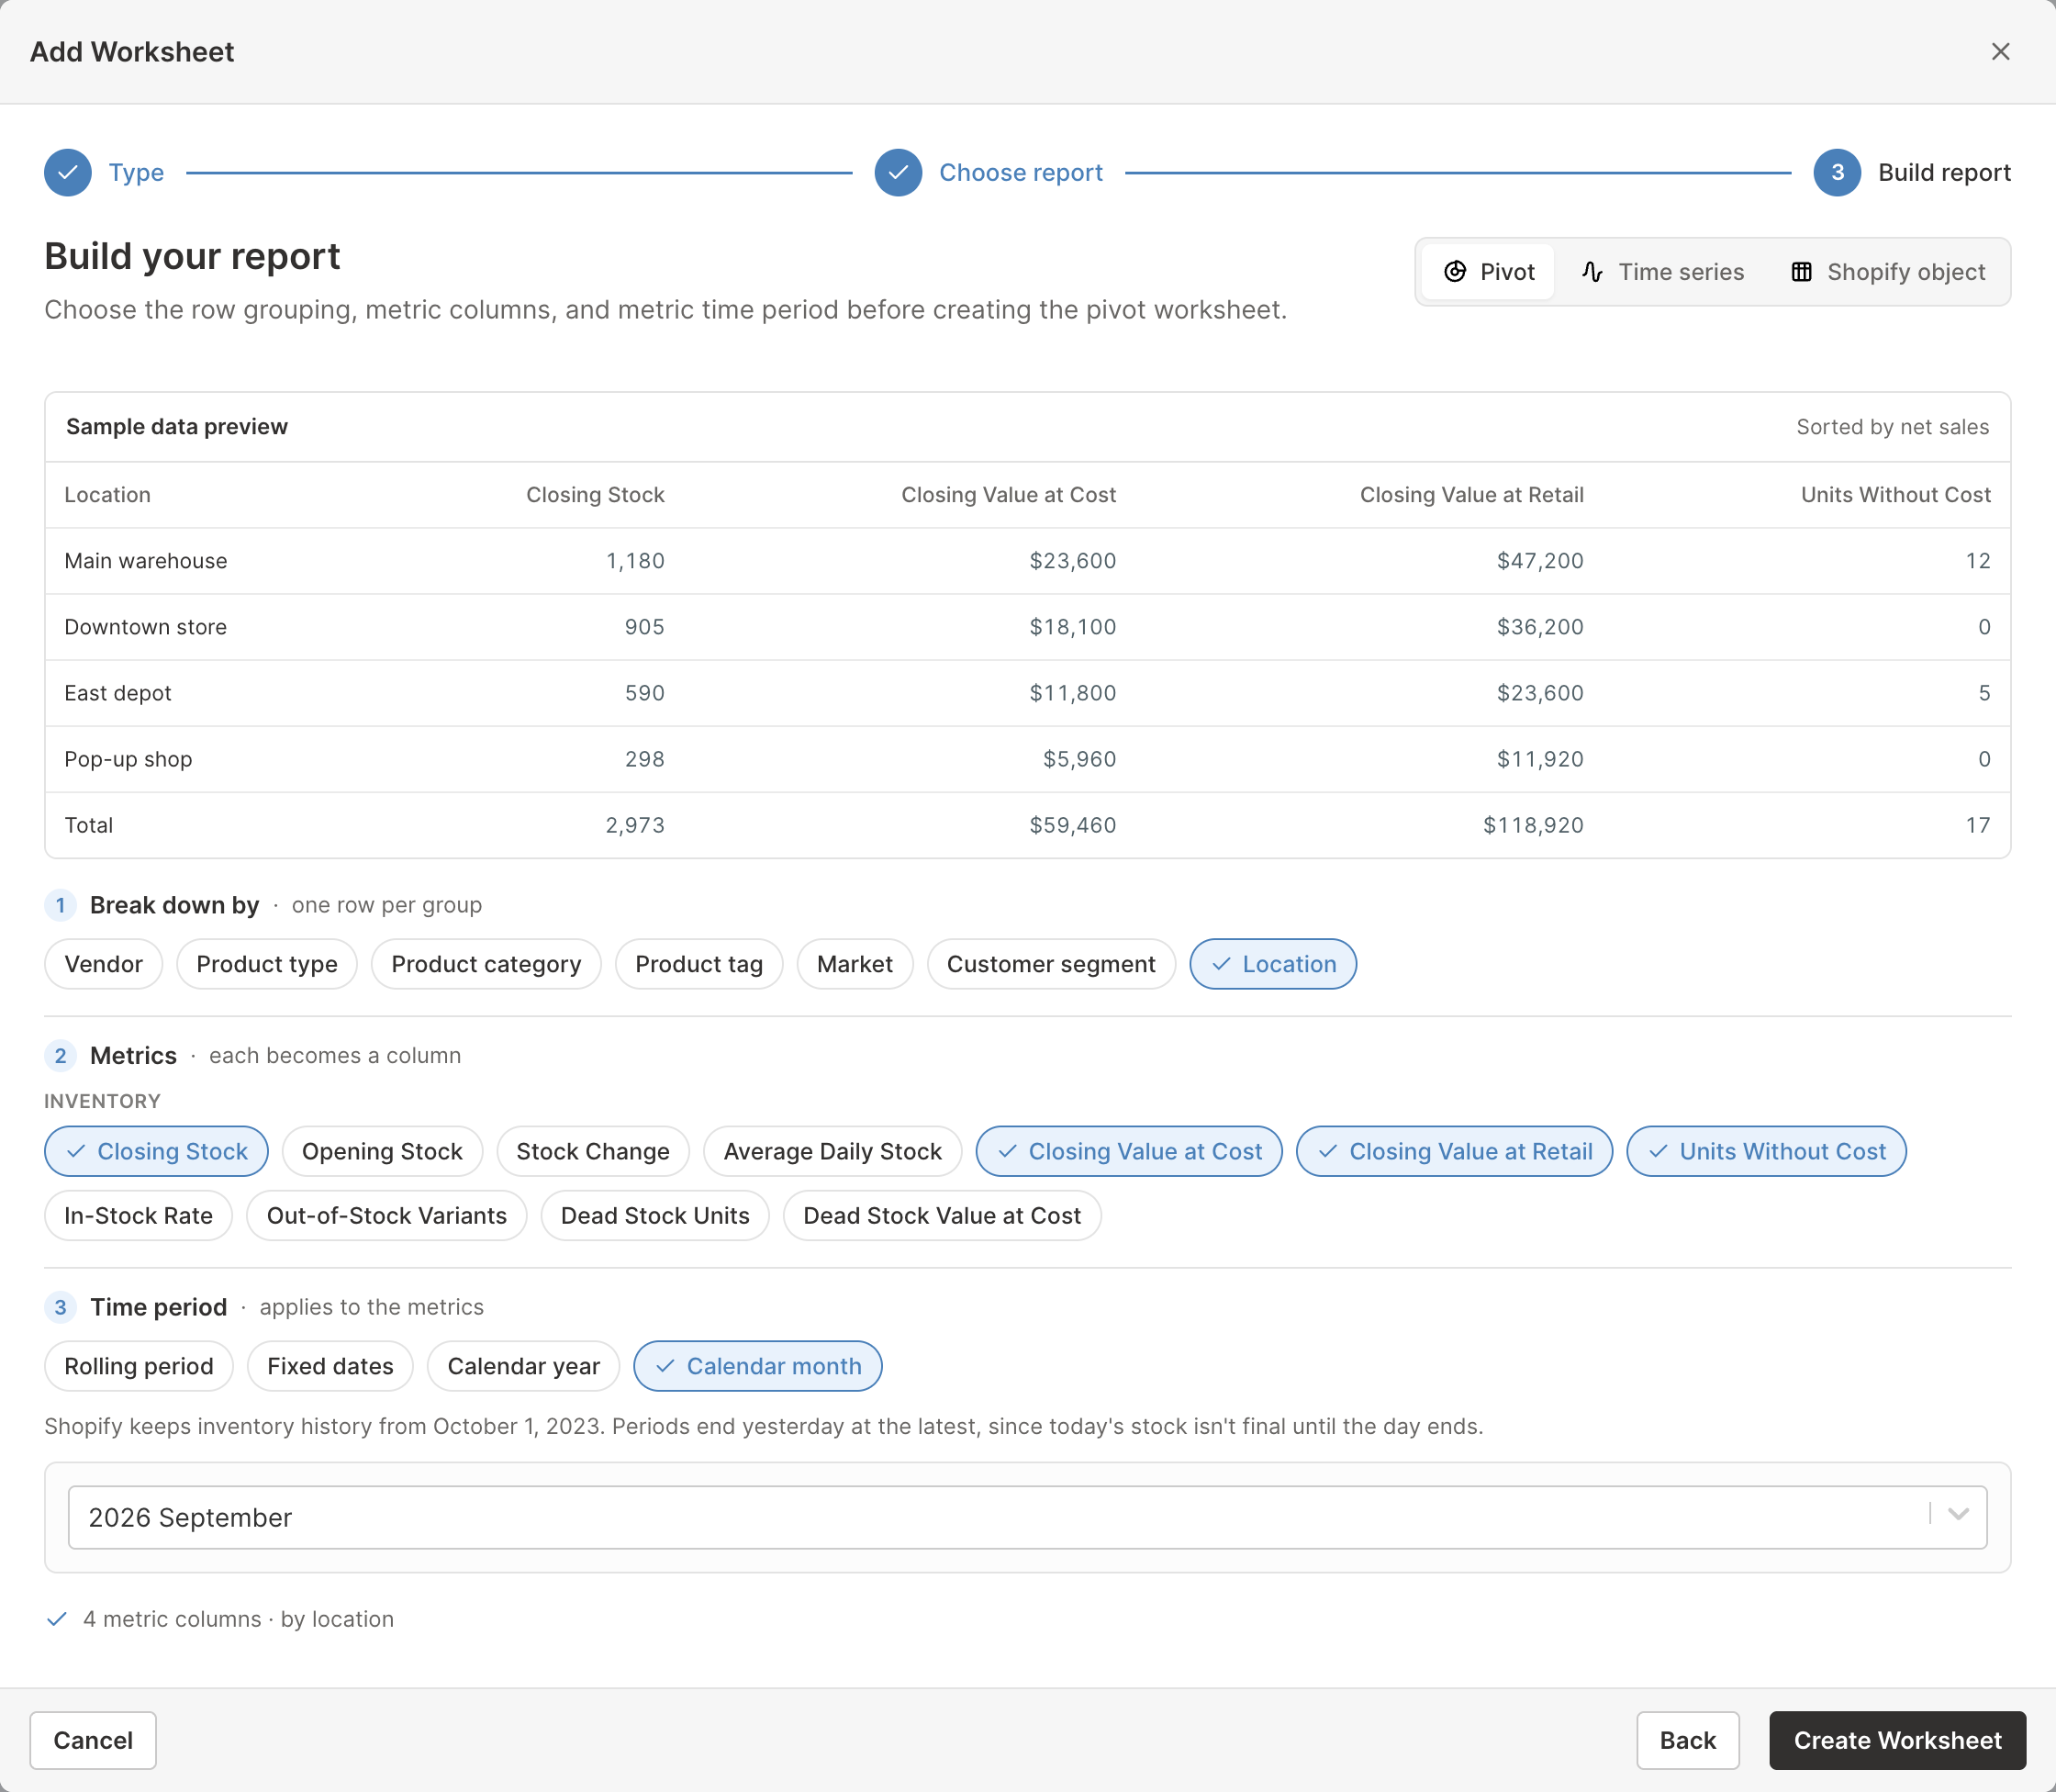
Each metric reads the stock at the end of the month’s last day. Add a Stock Change column for the same month to see which groups grew or shrank.

To follow inventory value month by month instead, create a Time Series worksheet, choose Store under Break down by, select Closing Stock and Closing Value at Cost under Metrics, and choose By month under Time periods. Each column then shows the stock and its value at the end of that month. See create a Time Series worksheet for Shopify data.
These are past days, not a live count
Closing Stock for yesterday describes a finished day, so it won’t match the stock in your Shopify admin right now. For current quantities by location, which you can also edit and sync with Mixtable Spreadsheet Editor, add an Inventory column to a Products (with variants) worksheet. See Shopify inventory management and tracking.
Next, see how often your products ran out in Shopify stockouts and in-stock rate, or how well stock turns into sales in Shopify sell-through rate, inventory turnover, and dead stock.