


Shopify Total Sales Analytics
Shopify Total Sales Analytics
Total Sales measures the broader Shopify order value by combining Net Sales with tax, shipping excluding tax, duties, and additional fees. It is useful when merchandise revenue alone does not describe the full amount associated with the orders in your report.
How Shopify Total Sales is calculated
Total Sales = Net Sales + Tax + Shipping + Duties + Additional fees
Shipping is counted excluding tax, so the tax component is never added twice. Because Total Sales includes money you collect and pass on, it describes what an order was worth rather than what your store earned.
Why Total Sales is worth reporting
Net Sales answers “how much merchandise revenue did we keep.” Total Sales answers a different question: how much money the order was actually worth once tax, shipping, duties, and fees are counted.
That gap matters more than most merchants expect, especially if you ship heavy items, sell internationally, or charge for delivery. A customer segment with modest Net Sales can be carrying a large share of your shipping and duty revenue, and you would never see it from a merchandise number.
Reporting Total Sales beside Net Sales tells you:
- How much of an order’s value comes from the product versus everything added on top
- Which customers, companies, or markets generate the most order value overall
- Whether shipping and duty charges are a meaningful part of your business or a rounding error
- Which figure to quote when someone asks what a customer or account is “worth”
Use Net Sales to rank merchandise performance and Total Sales when the full amount on the order is what matters, such as reconciling against payouts or sizing a wholesale account.
Total Sales, Net Sales, and Gross Sales
| Metric | What it emphasizes |
|---|---|
| Gross Sales | Original merchandise value before discounts and returns |
| Net Sales | Merchandise sales after discounts and returns, excluding tax |
| Total Sales | Net Sales plus tax, shipping excluding tax, duties, and additional fees |
Use Gross Sales to understand original demand. Use Net Sales to rank retained merchandise revenue. Use Total Sales when the wider Shopify order amount matters.
Where Total Sales is available
Total Sales is available on supported customer, company, company-location, and store-level analytics. It can also appear in the Pivot Table worksheet metric builder and in configured store-performance reporting where supported.
The metric menu on the selected worksheet is the final guide because Shopify analytics availability differs by target.
Add Total Sales to a Shopify data worksheet
-
Open a supported Shopify data worksheet, then select an empty column or insert a new one. Empty columns have a non-green header; a green header means the column is already linked to Shopify data
-
Click the
 button in the column header
 -
Choose Analytics
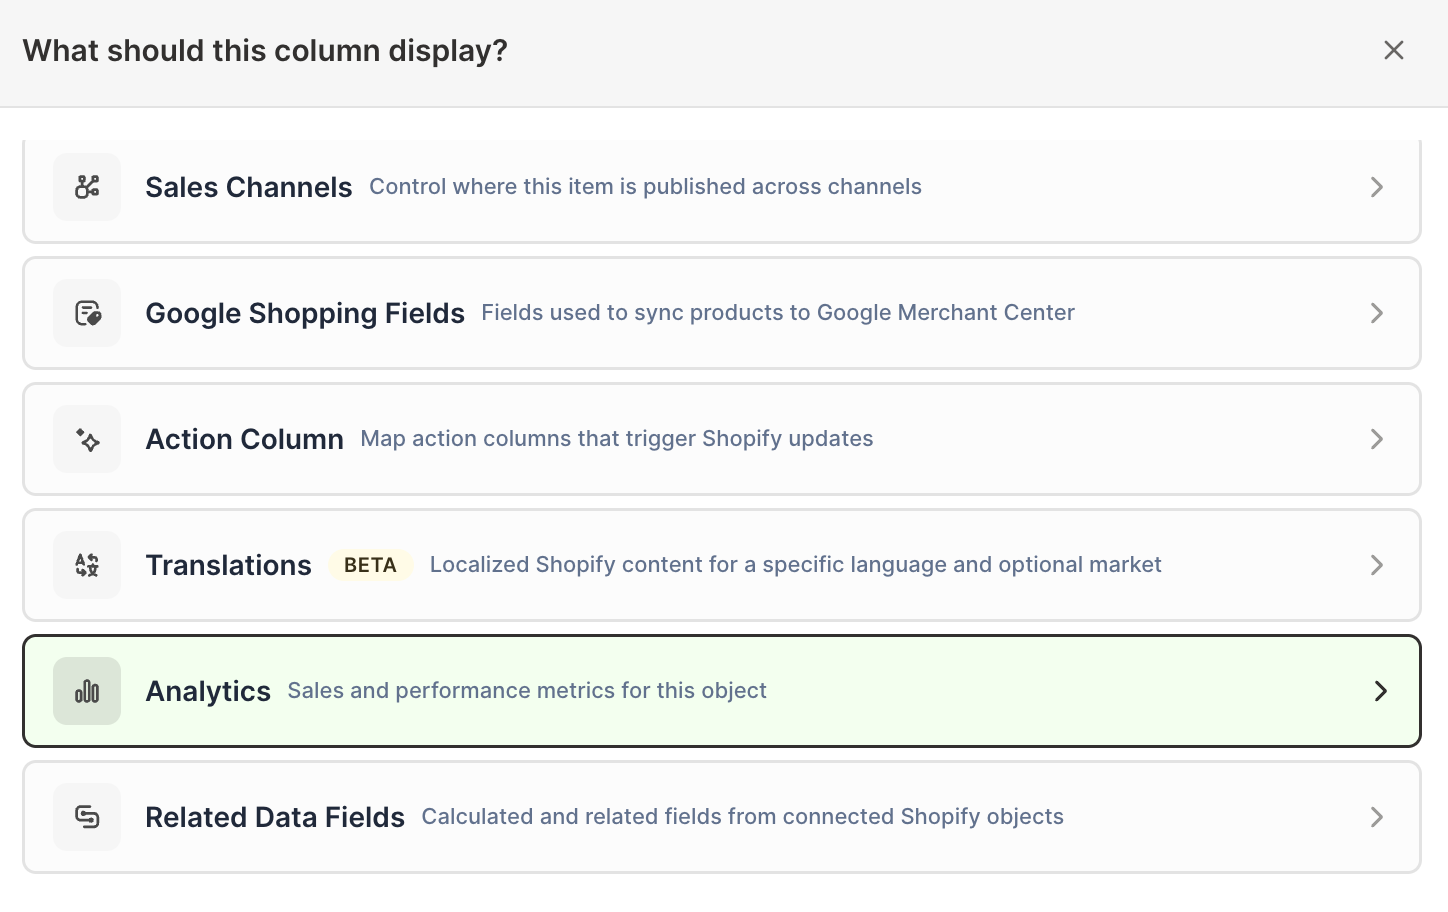
-
Under Which metric?, select Total Sales
-
Under Over what time period?, choose All time, Fixed dates, Rolling period, Calendar year, or Calendar month
-
Under Limit which orders count, add any optional filters supported by the metric
-
Click Save Column
Add Net Sales beside Total Sales when you want to see how much tax, shipping, duties, and fees contribute to the wider result.
Compare Total Sales in a Pivot Table worksheet
The Pivot Table worksheet builder includes Total Sales under the Sales metric group when the report supports it.
- Add an Reporting worksheet
- Choose a ready-made Pivot Table report or Blank pivot table
- Choose the breakdown
- Add Total Sales under Metrics
- Choose the timeframe
- Click Create Worksheet
Pair it with Net Sales, Orders Count, Average Order Value, Total Shipping, Total Tax, duties, and fees where supported.
Useful Total Sales reports
Customer reporting
Total Sales helps rank customers by the wider order amount. Keep Orders Count and Average Order Value beside it so one unusually large order does not define the customer without context.
Shopify B2B reporting
On Company or Company Location worksheets, Total Sales can help compare wholesale accounts where shipping, duties, or fees represent meaningful differences between customers.
Market and store reporting
Store-level reporting can place Total Sales beside tax, shipping, duties, and fees across recent months. Market reporting can help explain why two regions with similar Net Sales produce different broader order totals.
Build a Total Sales bridge
A useful set of columns is:
- Net Sales
- Total Tax Amount
- Total Shipping Amount
- Total Duties
- Total Additional Fees
- Total Sales
Use the same timeframe and filters for every column. The values then form a readable bridge from merchandise revenue to the broader Shopify order amount.
Small differences can occur when metrics have different target availability or underlying eligibility. Always compare columns created for the same worksheet rows, dates, and filters.
Total Sales is not profit or cash received
Total Sales does not subtract Cost of Goods Sold, payment processing, marketing, operating expenses, or other business costs. It is also not a bank-deposit or Shopify Payments payout metric.
Use Shopify profit and margin analytics for product-cost reporting. Use Payout and Balance Transaction worksheets when you need Shopify Payments settlement records.
For charge definitions, see Shopify tax, shipping, duties, and fee analytics.
Manage Shopify data in a spreadsheet.
Use Mixtable to edit, sync, analyze, import, and export your Shopify store data without CSV juggling.