


Ready-Made Shopify Analytics Reports
Ready-Made Shopify Analytics Reports
Mixtable’s ready-made reports are starting points, not a menu of what reporting worksheets can do. Each one opens the report builder with a breakdown, metrics, timeframe, and fields already chosen, so you get a working report in a few clicks instead of a blank page.
These are starters, not limits
Nothing about a ready-made report is fixed. Before you create the worksheet you can change the breakdown, swap the metrics, and set a different timeframe. After you create it, you can add more metric columns, add your own rows, sort, filter, and add formulas.
You are also not required to start from one. A Blank pivot table or Blank time series gives you the same builder with nothing preselected. Within a worksheet type, the report you pick never limits you: a Pivot Table worksheet created from Vendor sales leaderboard can do everything a blank Pivot Table worksheet can, and the same is true for Time Series.
The breakdowns each report uses are the quick options offered while you create the worksheet. They fill every row in one step, which is why they exist, but they are not the boundary of what a row can be. Once a worksheet exists you can add rows you define yourself, choosing the Shopify object and writing conditions that select exactly the records you want. That is how you report on a group no Shopify field describes, such as one vendor’s tagged products, or variants above a cost threshold.
So treat this page as a shortcut list. If none of these reports matches your question, the answer is not that Mixtable cannot produce it, it is that you build it yourself:
- Start from any built-in breakdown, then add your own rows with conditions you write
- Track a supported metric by month or year in a Time Series worksheet
- Add analytics columns to any supported Shopify data worksheet
- Filter a metric by segment, country, channel, campaign, Market, B2B account, and more, wherever the metric supports it
The two worksheet types are not interchangeable, though. Pivot Table worksheets and Time Series worksheets offer different breakdowns and different metric choices, so pick the type that matches the shape of your question first, then adjust the report inside it. Each type’s own article lists exactly what it supports: Pivot Table worksheets and Time Series worksheets.
For what is possible beyond these starters, see Shopify analytics with Mixtable.
The library is organized into Pivot Table worksheets, Time Series worksheets, and Shopify data worksheets with analytics columns.
Open the report library
- Open the Mixtable spreadsheet where you want the report
- Click the + button beside the worksheet tabs
- Select Reporting worksheet, then click Continue
- Review the reports in each section
- Select a report, then click Continue
- Review or change its setup
- Click Create Worksheet
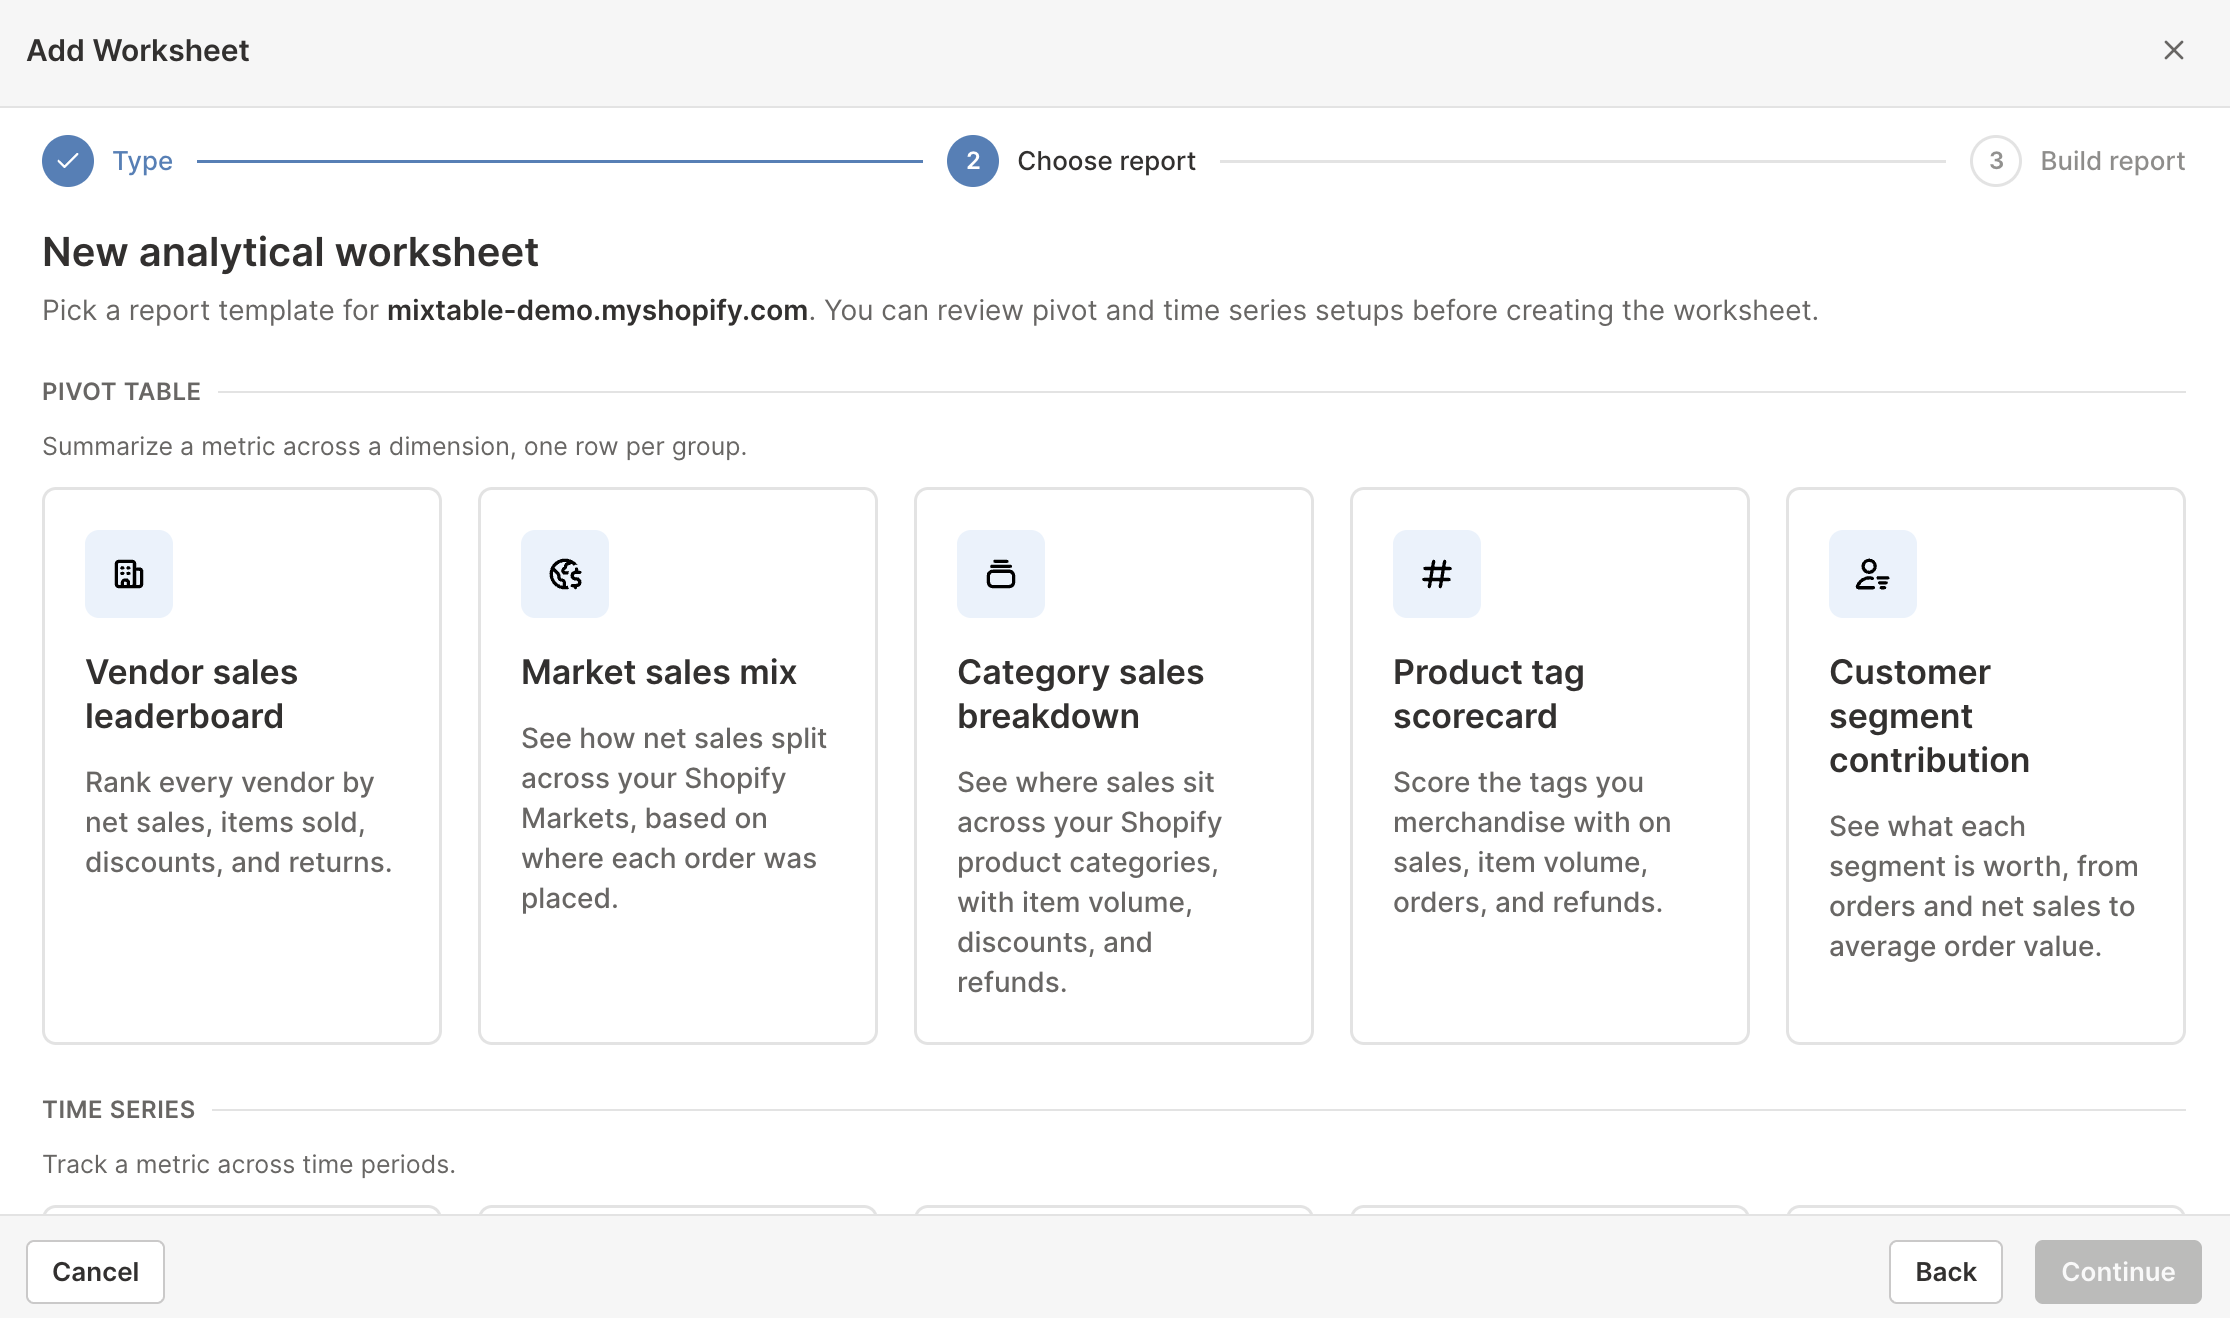
Pivot Table worksheet reports
Pivot Table worksheet reports create one row per group and one column per selected metric.
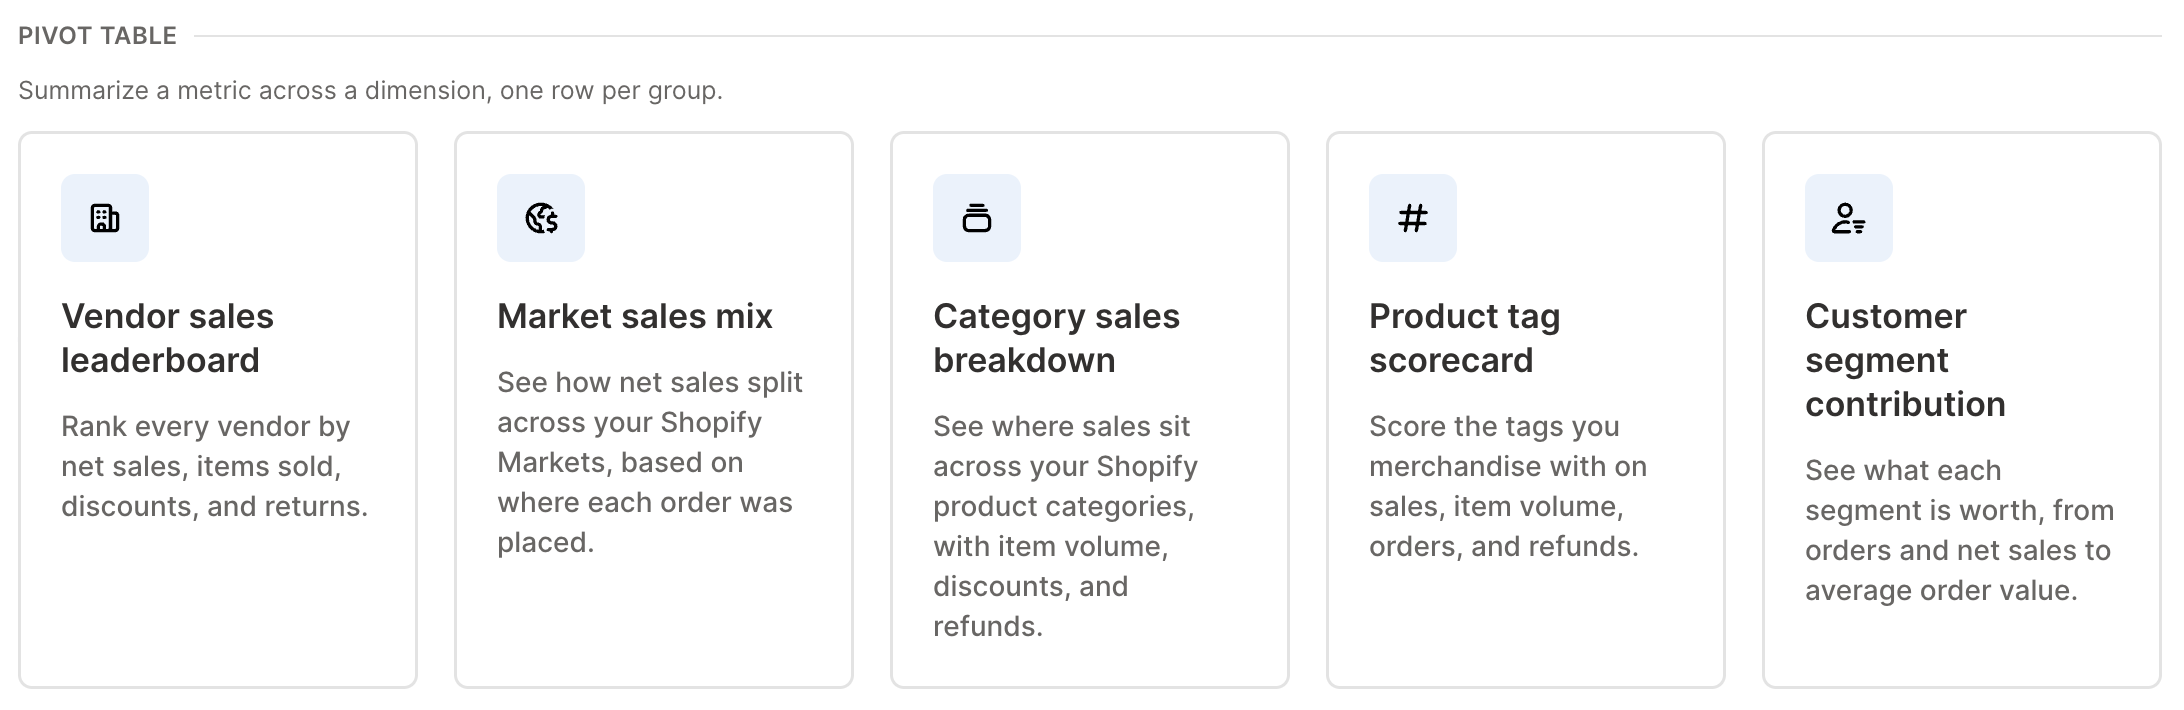
| Report | What it compares | Suggested metrics |
|---|---|---|
| Vendor sales leaderboard | Shopify product vendors | Net Quantity Sold, Gross Sales, discounts, refunds, and Net Sales |
| Market sales mix | Shopify Markets where orders were placed | Net Quantity Sold, Gross Sales, discounts, refunds, and Net Sales |
| Category sales breakdown | Shopify’s standardized product categories | Net Sales, Gross Sales, Net Quantity Sold, discounts, and refunds |
| Product tag scorecard | Product tags used for merchandising | Net Sales, Gross Sales, Net Quantity Sold, Orders Count, and refunds |
| Customer segment contribution | Shopify customer segments | Orders Count, Gross Sales, discounts, refunds, Net Sales, and Average Order Value |
Before creating the worksheet, you can switch the breakdown to vendor, product type, product category, product tag, Market, or customer segment. You can also add or remove metrics and change the timeframe.
Use a Pivot Table worksheet report for a ranked comparison over one selected period. See create a Pivot Table worksheet for customization details.
Time Series reports
Time Series reports create recent monthly or yearly columns.
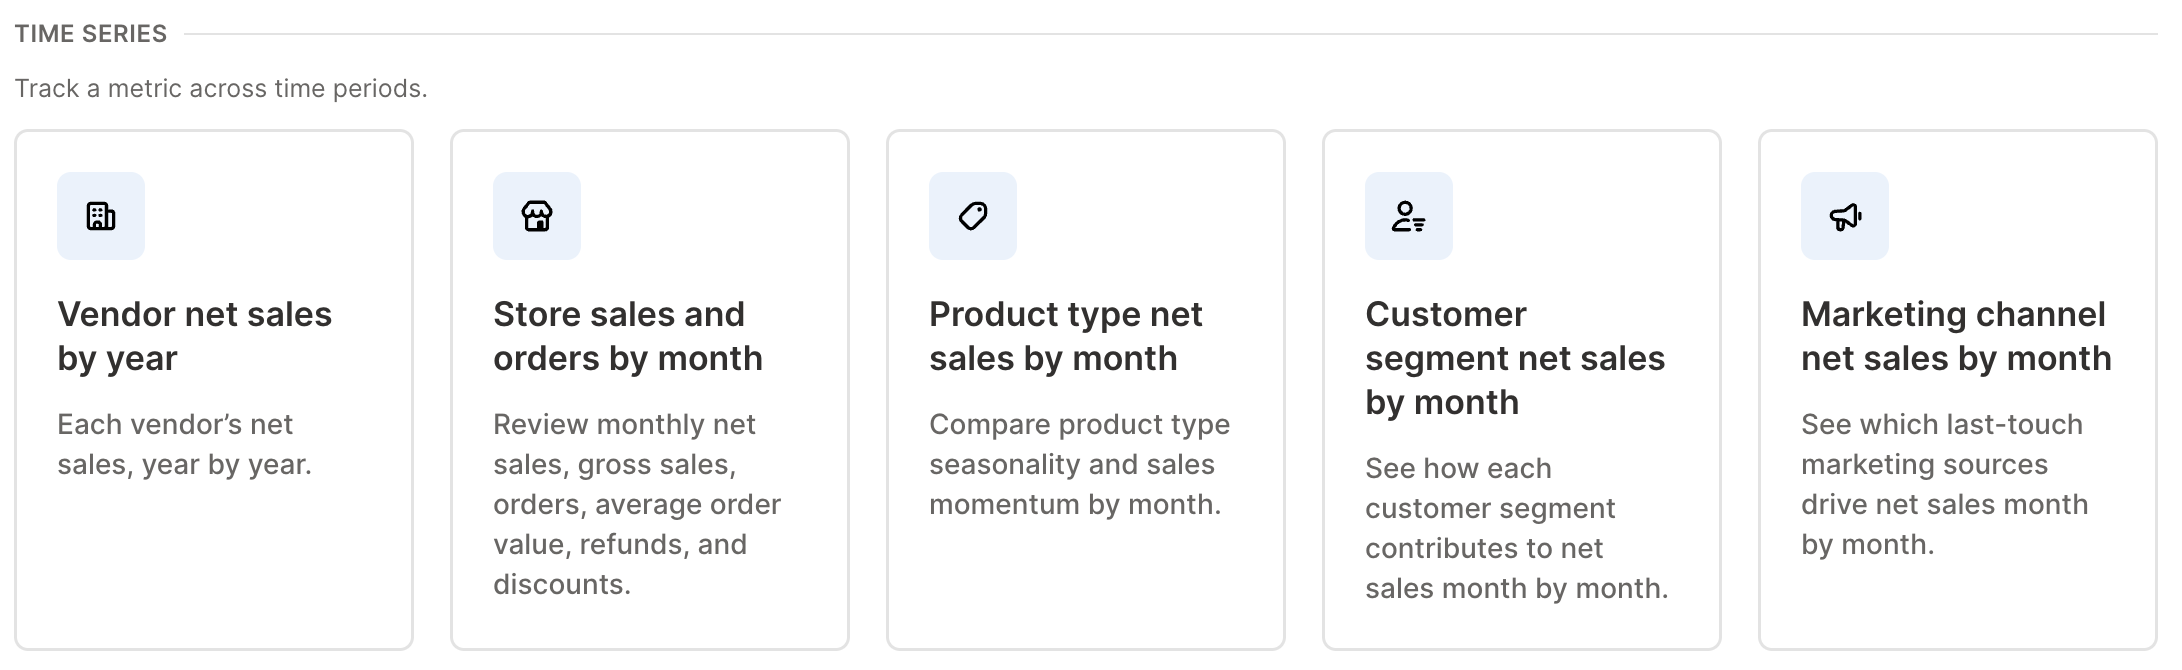
| Report | Rows | Default time periods |
|---|---|---|
| Vendor net sales by year | One row per vendor | Recent years |
| Store sales and orders by month | One row per selected store metric | Recent months |
| Product type net sales by month | One row per product type | Recent months |
| Customer segment net sales by month | One row per customer segment | Recent months |
| Marketing channel net sales by month | One row per last-touch marketing source | Recent months |
The Store report can include several metrics as rows. Other breakdowns measure one selected metric across all group rows. You can switch between monthly and yearly columns and choose how many recent periods to create.
Use these reports for seasonality, momentum, and growth questions. See create a Time Series worksheet.
Shopify data worksheets with analytics columns
These reports combine individual Shopify records with calculated analytics columns.
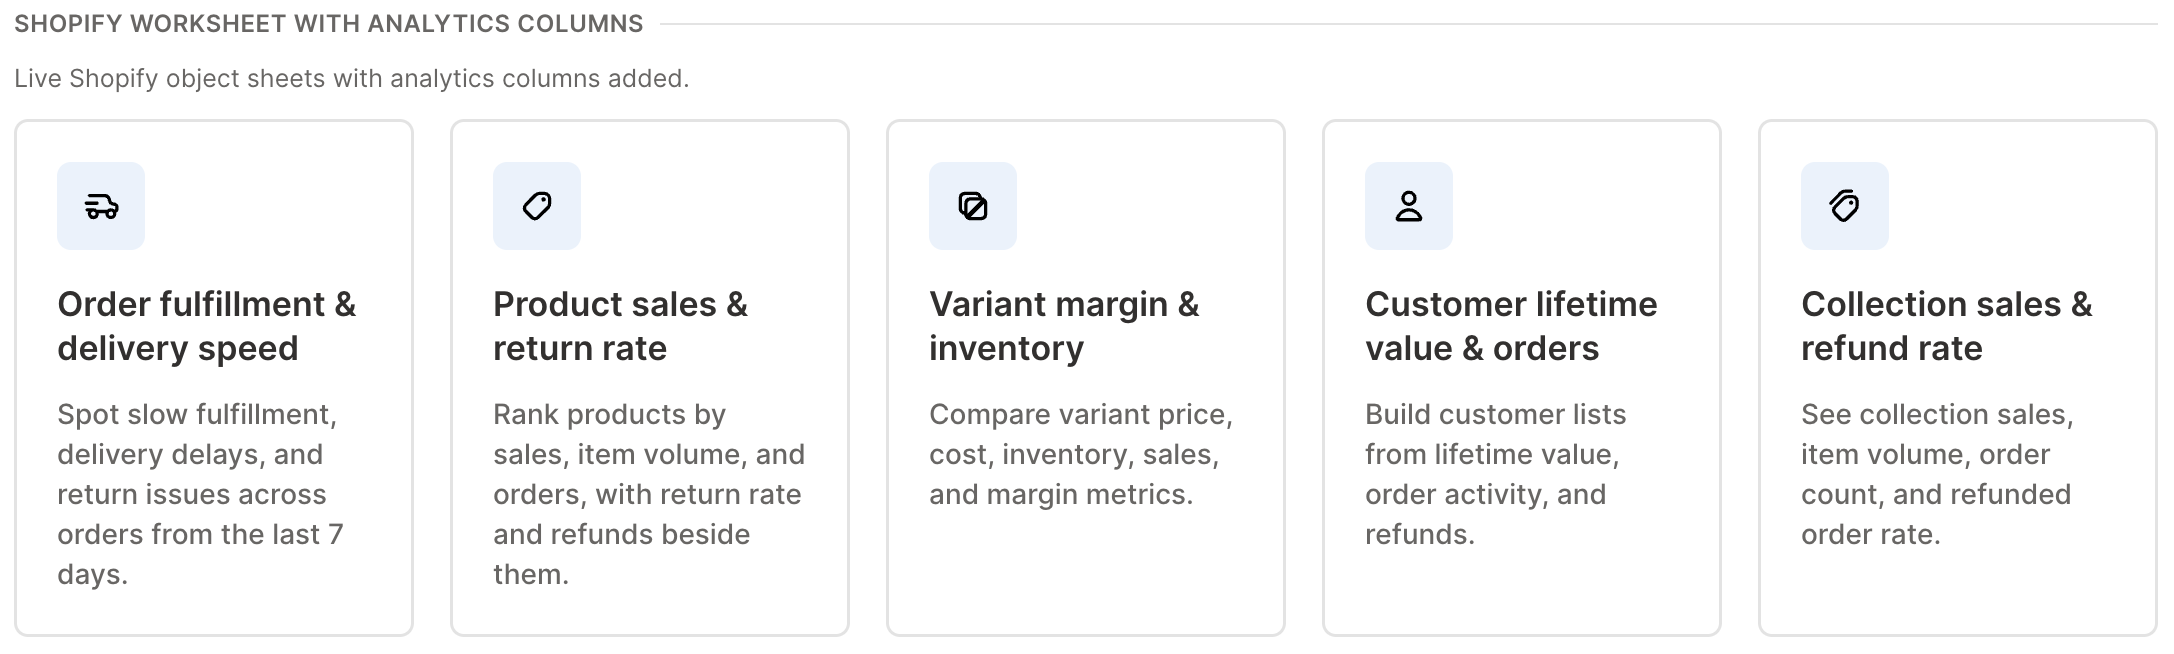
Order fulfillment & delivery speed
Creates an Orders worksheet for recent orders with order fields and:
- Fulfillment Count
- Average Hours To First Fulfillment
- Average Hours To Delivery
- Return Request Count
- Open Return Count
- Average Hours To Close A Return
Use it to find slow fulfillment, delivery delays, and unresolved returns. See Shopify fulfillment and delivery analytics.
Product sales & return rate
Creates a Products worksheet with title, vendor, product type, status, category, and:
- Net Sales
- Net Quantity Sold
- Orders Count
- Return Request Rate
- Total Refund Amount Excluding Tax
Use it to rank products while keeping the merchandising context visible.
Variant margin & inventory
Creates a Product Variants worksheet with product title, SKU, price, current cost, inventory, and:
- Cost of Goods Sold
- Gross Profit
- Gross Margin
- Net Sales
- Net Quantity Sold
Use it to find variants that sell well but produce weak margins, or profitable variants that need inventory attention.
Customer lifetime value & orders
Creates a Customers worksheet with names, email, Shopify order count, tags, and:
- Customer Lifetime Value
- Orders Count
- Average Order Value
- Average Orders Count
- Total Refund Amount Excluding Tax
Important: Customer Lifetime Value is a profit metric: Net Sales excluding tax, minus the estimated cost of the goods the customer bought. It needs a Cost Per Item on every variant they purchased and shows N/A when one is missing. Add Total Sales or Net Sales with an All time timeframe when you want cumulative customer spend instead.
Collection sales & refund rate
Creates a Collections worksheet with title, handle, product count, sort order, and:
- Net Sales
- Gross Sales
- Net Quantity Sold
- Orders Count
- Percent of Orders Refunded
Use it to compare the commercial performance of Shopify collections without losing their merchandising details.
Start from scratch
Choose Blank pivot table or Blank time series when none of the suggested reports matches the layout you have in mind, or when you would rather set everything up yourself than adjust someone else’s starting point.
Blank does not mean a basic spreadsheet. It is still a Reporting worksheet with the same row and column controls, the same metrics, and the same filters as any other.
Starting blank is a convenience, not a requirement. Custom reporting rows, object conditions, and handpicked time periods all work in a worksheet you created from a ready-made report, so you can begin with a suggested report and reshape it as far as you like.
For the exact setup, see create a Pivot Table worksheet for Shopify data or create a Time Series worksheet for Shopify data.
Reports and spreadsheet templates are different
The report library adds one worksheet to the spreadsheet you already have open. A Shopify reporting template creates a complete new spreadsheet and may create more than one worksheet or a long schedule of monthly or yearly analytics columns.
See Shopify reporting templates when you want a complete prebuilt spreadsheet rather than one added report.
Manage Shopify data in a spreadsheet.
Use Mixtable to edit, sync, analyze, import, and export your Shopify store data without CSV juggling.