Shopify Product Variant Analytics
Shopify Product Variant Analytics
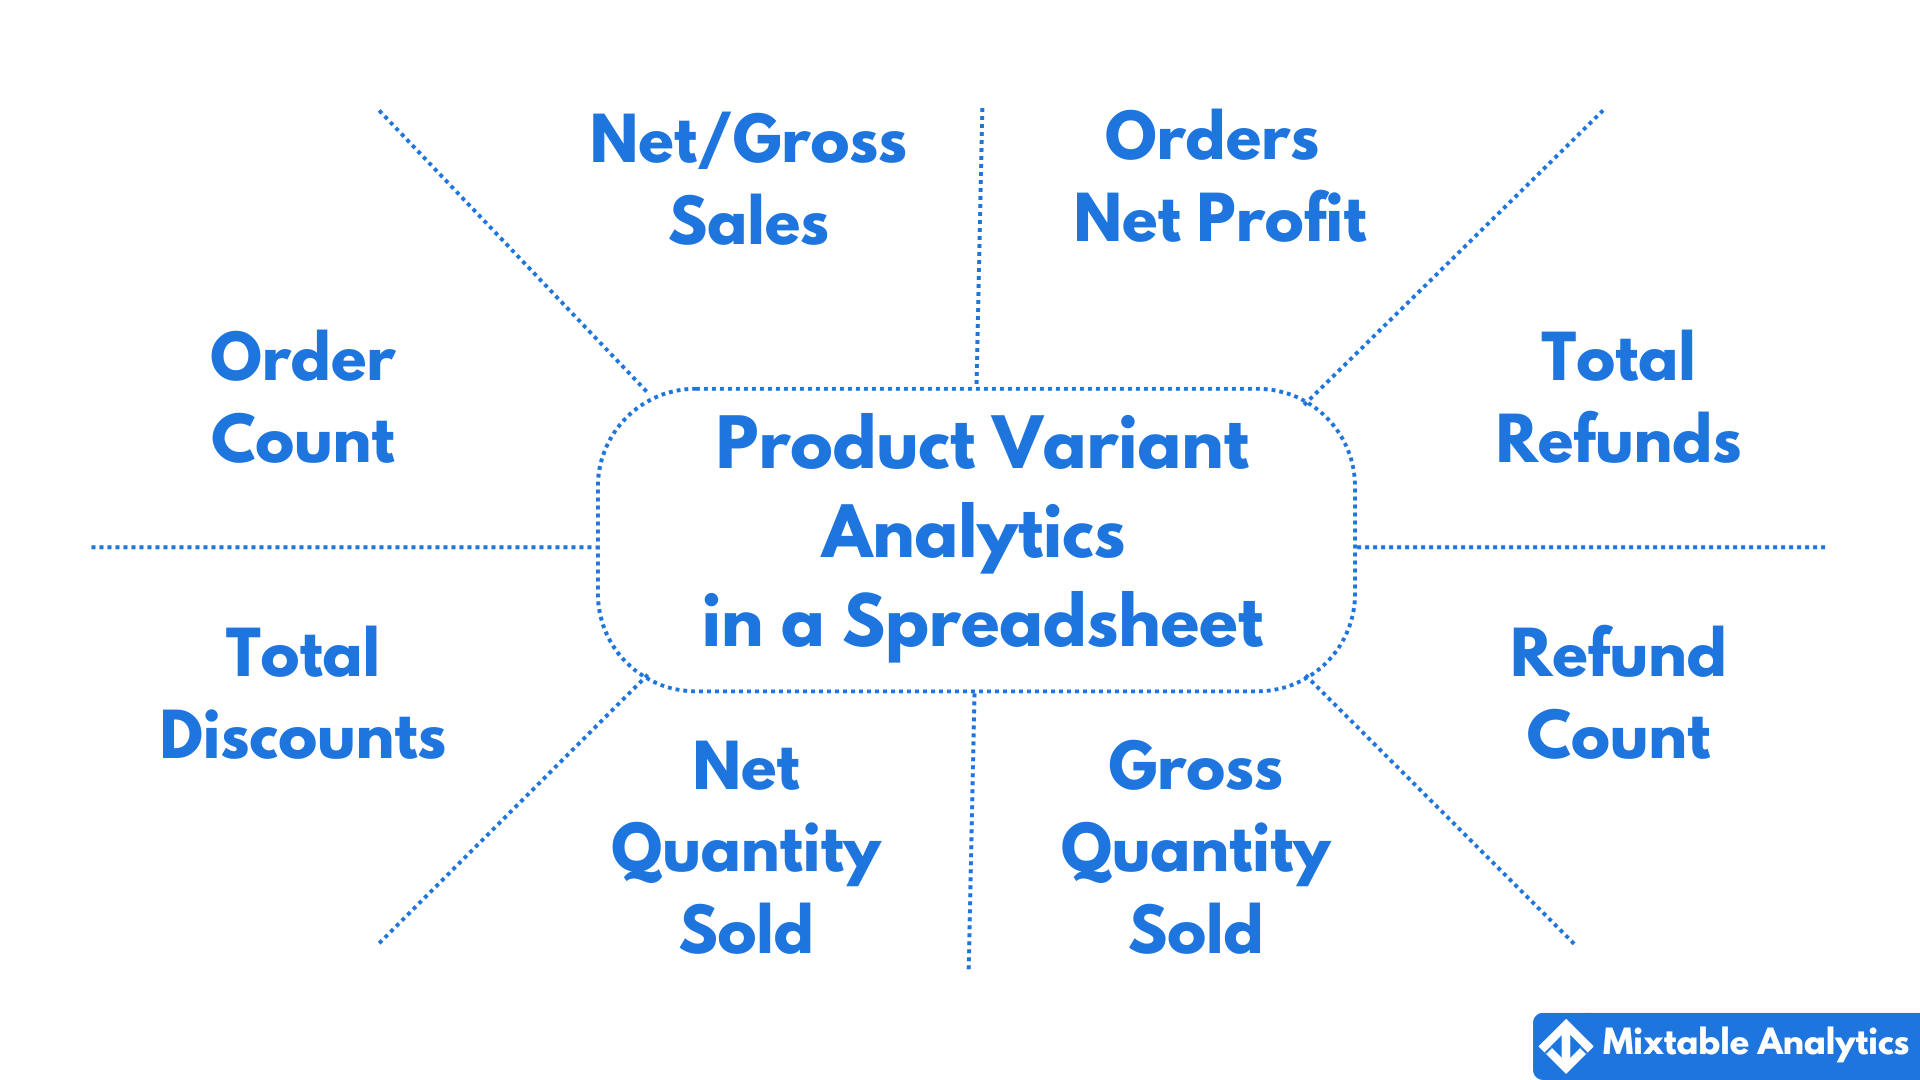
Do you know which product variant performs best in terms of the net profit it generates for your Shopify store? Or do you know if there were product variants where the discounts generated fewer orders? Analyzing the performance of product variants would provide you with an in-depth view of your store. With Product Variant analytics by Mixtable, you can see the net and gross sales, net profit, quantity sold, orders count, refunds, and discounts - all these from the convenience of an online spreadsheet!
How to add Shopify Product Variant analytics to a spreadsheet
If you have already created a Mixtable spreadsheet for your Shopify store, you can quickly add a new worksheet with product variants. Here is how to do it:
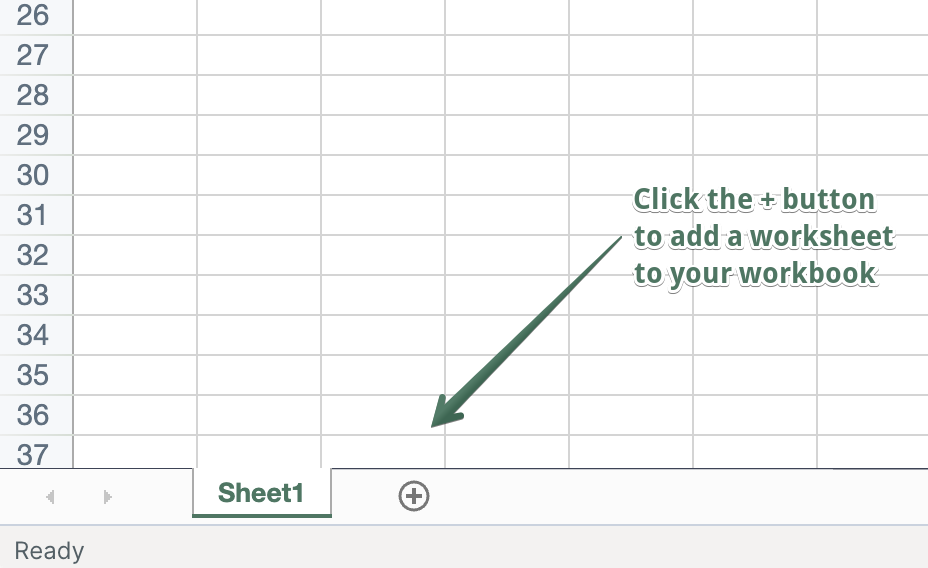
In an existing Mixtable spreadsheet, click the (+) button to add a new worksheet.
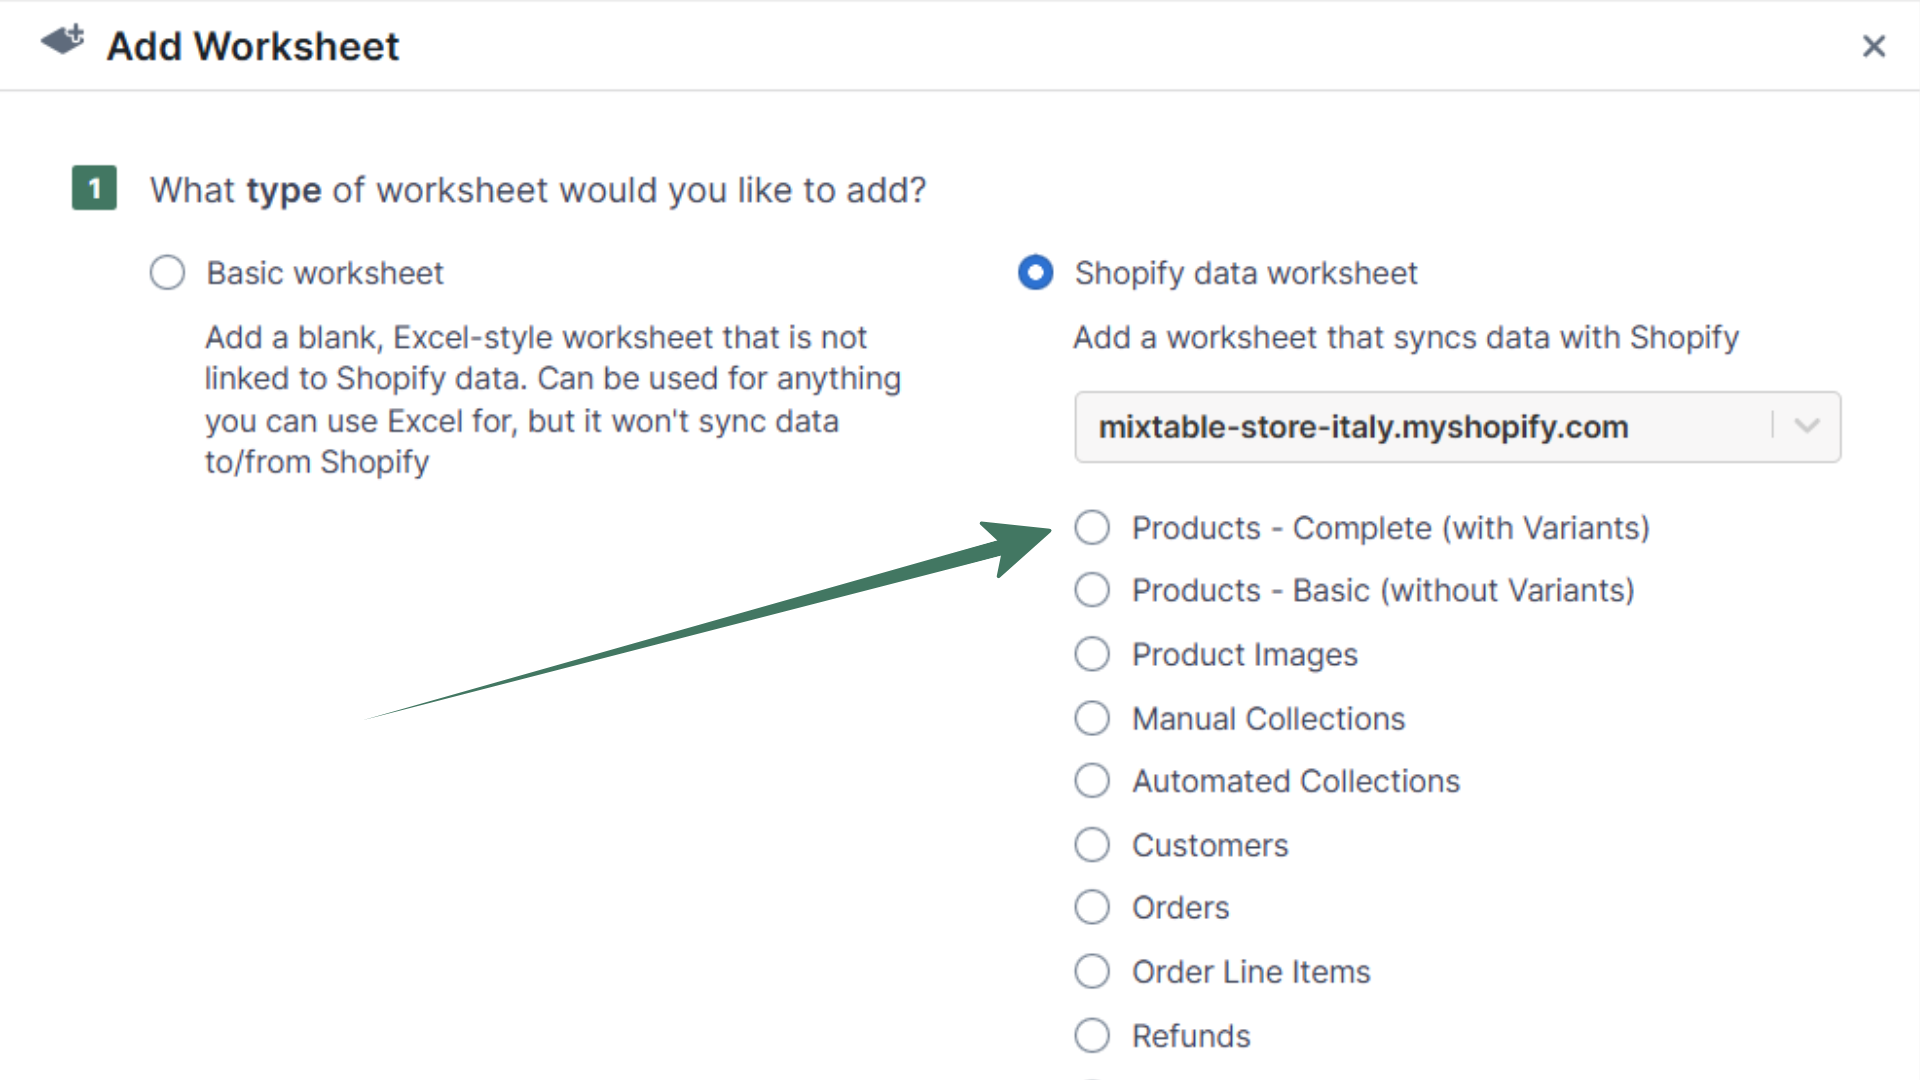
- From the Add Worksheet window, choose Shopify data worksheet > Products (with variants).
- Select Load all Shopify data to see the available columns that will be loaded in the worksheet. You can remove and rearrange the columns.
PRO TIP - Start with one of our pre-built data templates
Instead of manually loading the product variant data in a worksheet, you can get going faster by starting with one of our template spreadsheets. These spreadsheets come pre-loaded with the types of analytics that our clients tend to need most. Here’s how to do this:
- After installing the Mixtable Analytics Spreadsheet app, click the Create Spreadsheet button.
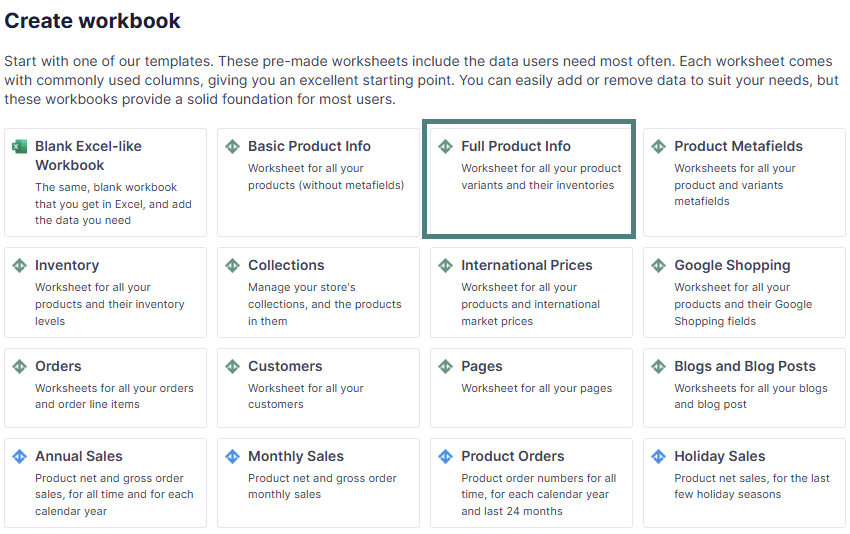
- In the dialog that appears, select the Full Product Info pre-built template, which includes all your product variants and their inventories. Now, you can add analytics data to columns in this worksheet.
Net Sales / Gross Sales analytics per Shopify product variant
Here’s how to map Net Sales or Gross Sales per product variant into your Mixtable spreadsheet:
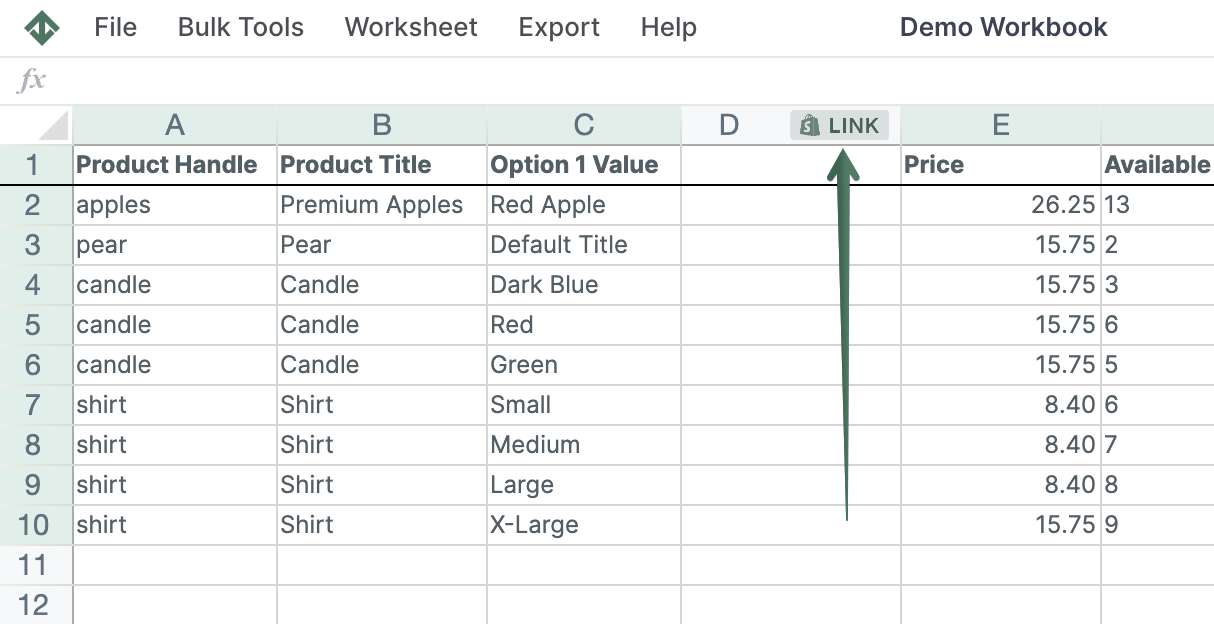
To load new Shopify data, start by selecting an empty column — any column with a non-green header (green headers mean the column is already linked to Shopify data). Then, click the  button in the column header to open the selection window to choose the data you want to pull in.
-
From the Shopify Sync Settings window, choose Analytics
-
Then, select the Net Sales, Net Sales (Accrual Basis), or Gross Sales metric from the drop-down list. Net Sales uses a cash basis calculation that matches Shopify’s own reports; Net Sales (Accrual Basis) uses accrual accounting. See Net Sales Analytics for details on the difference.
-
Select the time range that you want the sales per product variant to be calculated for
- All orders - all data since the creation of the store
- Fixed date range - show data for a specific period between two dates
- Dynamic date range - calculate the sales data for a dynamic time period in the past, e.g., last 7 days, last 30 days. If you select this option, the data will be recalculated daily as the date range window moves forward.
- Calendar year and month - show the sales data for a specific year (e.g., 2024) or a specific month (e.g., May 2024).
Net Quantity Sold / Gross Quantity Sold analytics per Shopify product variants
Here’s how to map Net Quantity Sold or Gross Quantity Sold per product variant into your Mixtable spreadsheet:
-
In your Product variants worksheet, select an empty column (or insert a new one).
-
Then click Link from the column header.
-
From the Shopify Sync Settings window, choose Analytics
-
Then, select the Net Quantity Sold or Gross Quantity Sold metric from the drop-down list.
-
Select the time range which you want the sold quantity to be calculated:
- All orders - all data since the creation of the store
- Fixed date range - show data for a specific period between two dates
- Dynamic date range - calculate the sold quantity data for a dynamic period in the past, e.g., last 7 days, last 30 days. If you select this option, the data will be recalculated daily as the date range window moves forward.
- Calendar year and month - show the sold quantity data for a specific year or month.
Orders Count analytics per Shopify product variants
Here’s how to map Orders Count per product variant into your Mixtable worksheet:
-
In your Product variants worksheet, select an empty column (or insert a new one).
-
Then click Link from the column header.
-
From the Shopify Sync Settings window, choose Analytics
-
Then, select the Orders Count metric from the drop-down list.
-
Select the time range which you want the order count to be calculated:
- All orders - all data since the creation of the store
- Fixed date range - show data for a specific period between two dates
- Dynamic date range - get the orders count for a dynamic period in the past, e.g., last 7 days, last 30 days. If you select this option, the data will be recalculated daily as the date range window moves forward.
- Calendar year and month - show the data for a specific year or month.
Orders Net Profit analytics per Shopify product variants
Here’s how to map Orders Net Profit per product variant into your Mixtable worksheet:
-
In your Product variants worksheet, select an empty column (or insert a new one).
-
Then click Link from the column header.
-
From the Shopify Sync Settings window, choose Analytics
-
Then, select the Orders Net Profit metric from the drop-down list.
-
Select the time range for which you want the profit to be calculated:
- All orders - all data since the creation of the store
- Fixed date range - show data for a specific period between two dates
- Dynamic date range—Get the net profit for a dynamic time period in the past, e.g., the last 7 days or the last 30 days. If you select this option, the data will be recalculated daily as the date range window moves forward.
- Calendar year and month - show the data for a specific year or month.
Total Refund Amount analytics per Shopify product variants
Here’s how to map Total Refund Amount per product variant into your Mixtable worksheet:
-
In your Product variants worksheet, select an empty column (or insert a new one).
-
Then click Link from the column header.
-
From the Shopify Sync Settings window, choose Analytics
-
Then, select the Total Refund Amount metric from the drop-down list.
-
Select the time range for which you want the refund amount to be calculated:
- All orders - all data since the creation of the store
- Fixed date range - show data for a specific period between two dates
- Dynamic date range—Get the refund amount for a dynamic period in the past, e.g., the last 7 days or the last 30 days. If you select this option, the data will be recalculated daily as the date range window moves forward.
- Calendar year and month - show the data for a specific year or month.
Refund Count analytics per Shopify product variants
Here’s how to map Refund Count per product variant into your Mixtable worksheet:
-
In your Product variants worksheet, select an empty column (or insert a new one).
-
Then click Link from the column header.
-
From the Shopify Sync Settings window, choose Analytics
-
Then, select the Refund Count metric from the drop-down list.
-
Select the time range which you want the refund count to be calculated:
- All orders - all data since the creation of the store
- Fixed date range - show data for a specific period between two dates
- Dynamic date range — get the refund count for a dynamic period in the past, e.g., the last 7 days or the last 30 days. If you select this option, the data will be recalculated daily as the date range window moves forward.
- Calendar year and month - show the data for a specific year or month.
Total Discount Amount analytics per Shopify product variants
Here’s how to map Total Discount Amount per product variant into your Mixtable worksheet:
-
In your Product variants worksheet, select an empty column (or insert a new one).
-
Then click Link from the column header.
-
From the Shopify Sync Settings window, choose Analytics
-
Then, select the Total Discount Amount metric from the drop-down list.
-
Select the time range for which you want the discount amount to be calculated:
- All orders - all data since the creation of the store
- Fixed date range - show data for a specific period between two dates
- Dynamic date range—Get the discount amount for a dynamic time period in the past, e.g., the last 7 days or the last 30 days. If you select this option, the data will be recalculated daily as the date range window moves forward.
- Calendar year and month - show the data for a specific year or month.
Percent of Orders Refunded analytics per Shopify product variants
-
In your Product variants worksheet, select an empty column (or insert a new one).
-
Then click Link from the column header.
-
From the Shopify Sync Settings window, choose Analytics.
-
Then, select the Percent of Orders Refunded metric from the drop-down list.
-
Select the time range for which you want the Percent of Orders Refunded to be calculated:
- All orders - all data since the creation of the store
- Fixed date range - show data for a specific period between two dates
- Dynamic date range— get the percentage of refunded orders for a dynamic period in the past, e.g., the last 7 days or the last 30 days. If you select this option, the data will be recalculated daily as the date range window moves forward.
- Calendar year and month - show the data for a specific year or month.
Optional - filter Product variant data based on a Customer Segment
Mixtable Analytics allows you to filter the product variant data based on the customer segments you have created in Shopify.
- To do that, after selecting the analytics metric and the data range, use the Filter orders based on Customer Segment defined in Shopify Admin section to choose the customer segment to be used.
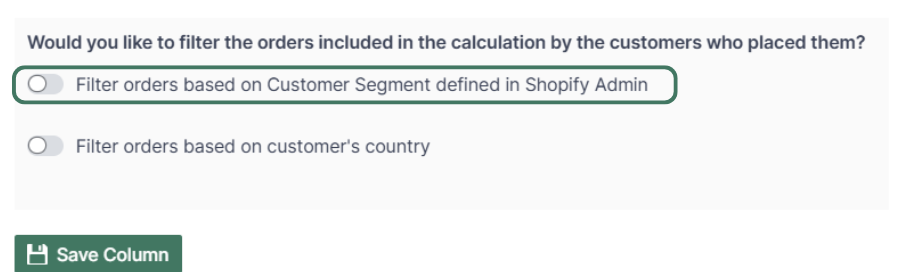
Note: The customer segments shown are the ones you have defined in your Shopify Admin. To add or change your segments please use the Shopify Admin, and Mixtable will reflect your changes automatically.
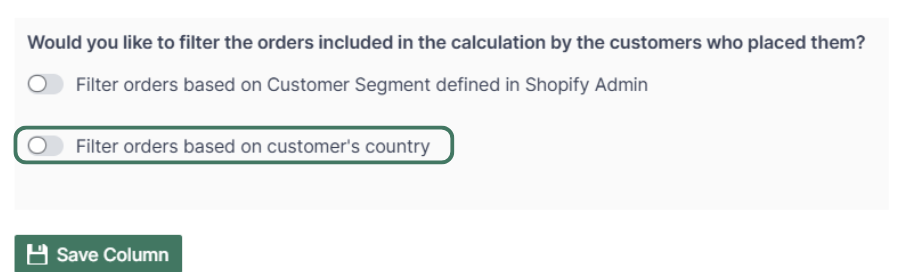
Optional - Product variant data by Country
Another option for filtering Product variant data is according to the customer’s country. Use this feature to calculate your international store performance.
- After selecting the analytics metric and the data range, use the Filter orders based on customer’s country to select the country for which to show the product variant data.
You are ready!
Well done! Now that you have Product variant data in an online spreadsheet, you can use any Excel function to analyze the data, such as:
- Sort ascending or descending,
- Find-replace,
- Filter,
- Use Excel formulas, e.g., for price changes, etc.
Find out more about the Mixtable suite of products here.
Manage Shopify data in a spreadsheet.
Use Mixtable to edit, sync, analyze, import, and export your Shopify store data without CSV juggling.