


Shopify Gross Quantity Sold Analytics
Shopify Gross Quantity Sold Analytics
Gross Quantity Sold is the number of units customers ordered, counted before any returned units are taken back out.
How Shopify Gross Quantity Sold is calculated
Gross Quantity Sold = the number of units ordered, before any returns
It counts units rather than orders, so one order containing twelve units adds twelve. Returned and refunded units are still included, which is what separates it from Net Quantity Sold.
Why measure demand before returns
Gross Quantity Sold answers one question cleanly: how much did customers want? Because it ignores price, discounts, and refunds, it is the purest read on demand your Shopify store produces.
That makes it the metric to reach for when you are:
- Judging how well a launch, campaign, or seasonal push landed
- Comparing sizes and colors on demand alone, before returns muddy the picture
- Planning production or purchase orders based on units, not revenue
- Working out whether a product’s problem is demand or something that happens after the sale
Pair it with Net Quantity Sold and Refunded Quantity, and the gap between them becomes the real signal. Strong Gross Quantity Sold with weak Net Quantity Sold means customers ordered the product and much of it was later refunded. Sizing, quality, and listings that oversell are common explanations, but the metrics flag the gap rather than identify the cause, so it is worth checking the orders themselves.
Add Gross Quantity Sold to a Shopify data worksheet
You can place Gross Quantity Sold beside editable Shopify data on supported product, variant, collection, and other Shopify data worksheets.
-
Open a supported Shopify data worksheet, then select an empty column or insert a new one. Empty columns have a non-green header; a green header means the column is already linked to Shopify data
-
Click the
 button in the column header
 -
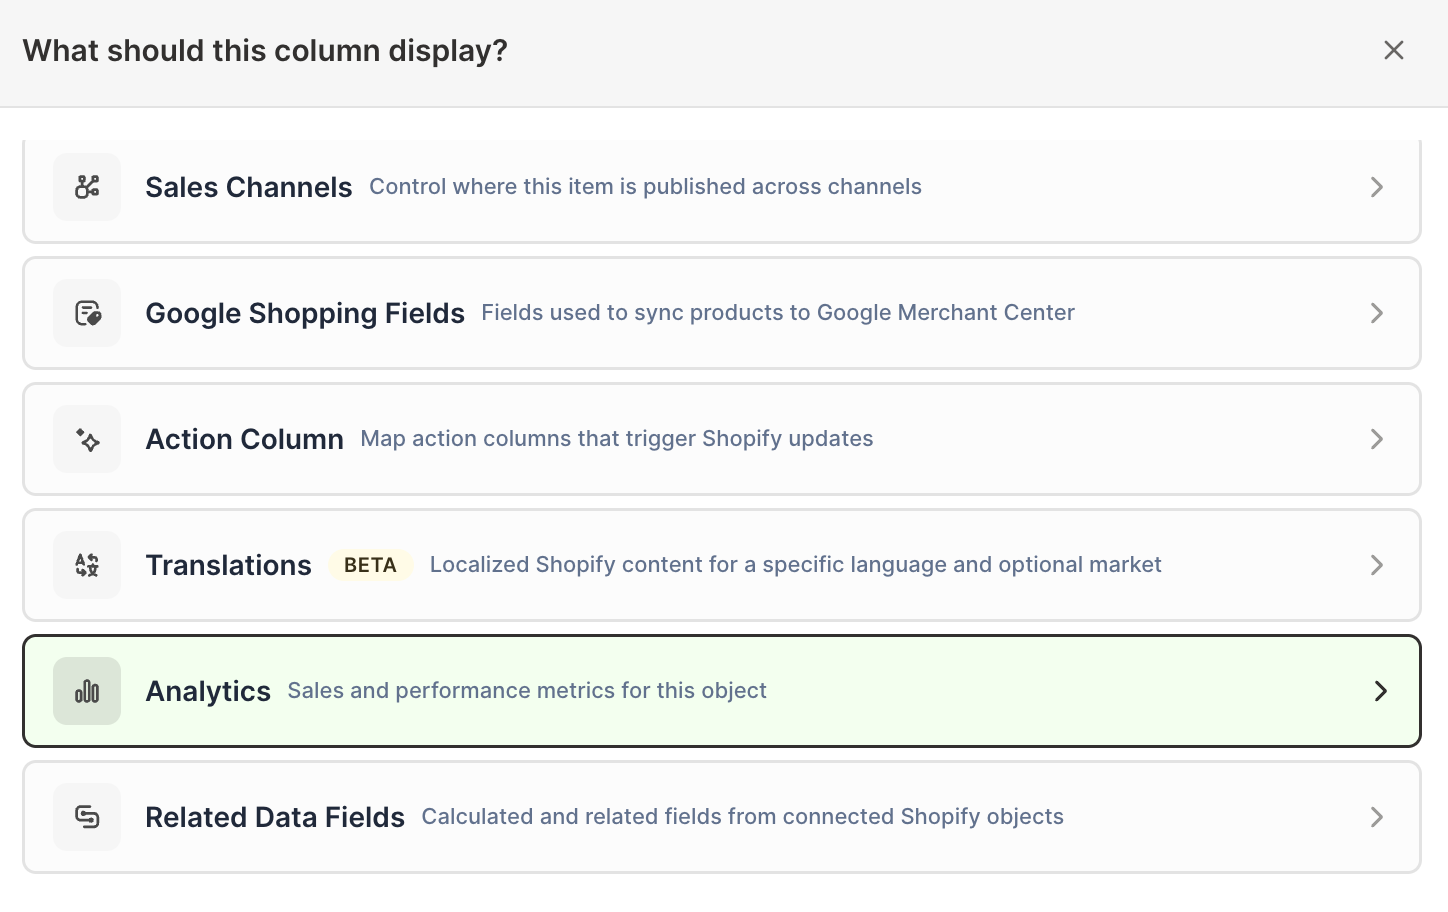
Choose Analytics
-
Under Which metric?, select Gross Quantity Sold
-
Under Over what time period?, choose All time, Fixed dates, Rolling period, Calendar year, or Calendar month
-
Under Limit which orders count, add any optional filters supported by the metric
-
Click Save Column
The available filters depend on the worksheet. They can include Shopify customer segment, customer country, discount campaign, fulfillment status, order source, order type, company, company location, and marketing attribution values.
Compare gross quantity with a Pivot Table worksheet
Use a Pivot Table worksheet when you want one row per business dimension instead of one row per Shopify object.
- Click the + button beside the worksheet tabs
- Select Reporting worksheet, then click Continue
- Select a Pivot Table report, or choose Blank pivot table
- Choose a breakdown such as vendor, product type, product category, product tag, market, or customer segment
- Add Gross Quantity Sold under Metrics
- Choose the timeframe and any supported filters
- Click Create Worksheet
Add Net Quantity Sold and Refunded Quantity to the same report to see how ordered, returned, and retained unit counts relate for every group at once.
Units are not orders
Gross Quantity Sold counts ordered units, not distinct orders. One order containing five units contributes five. Use Orders Count when you need the number of Shopify orders instead, and read the two together when you want to know whether growth came from more orders or from more units in each order.
Manage Shopify data in a spreadsheet.
Use Mixtable to edit, sync, analyze, import, and export your Shopify store data without CSV juggling.