


Shopify Sales by Vendor Template
Shopify Sales by Vendor Template
The Sales by Vendor template creates a Pivot Table worksheet with one row per Shopify product vendor. It helps compare supplier or brand performance across sales, units, discounts, refunds, and tax.
What vendor reporting tells you
Vendors are where a lot of money quietly leaks. Terms get agreed once and rarely revisited, and it is easy to keep reordering from a supplier out of habit rather than results.
One row per vendor makes the comparison concrete:
- Which suppliers earn the most, so you know where you have leverage on terms
- Which vendors need heavy discounting to sell, which is a margin problem disguised as a sales problem
- Which vendors’ products come back most often, since refunds are a supplier quality signal
- Which relationships have quietly gone flat and are worth reviewing before the next buy
Vendor is a single field on each product, so vendor rows do not overlap the way tag or collection rows can.
Metrics included
The template creates a Sales by Vendor worksheet with:
- Vendor name
- Net Items Sold
- Gross Sales
- Discounts
- Returns Excluding Tax
- Net Sales
- Taxes
The metrics use an all-time timeframe when the template is created.
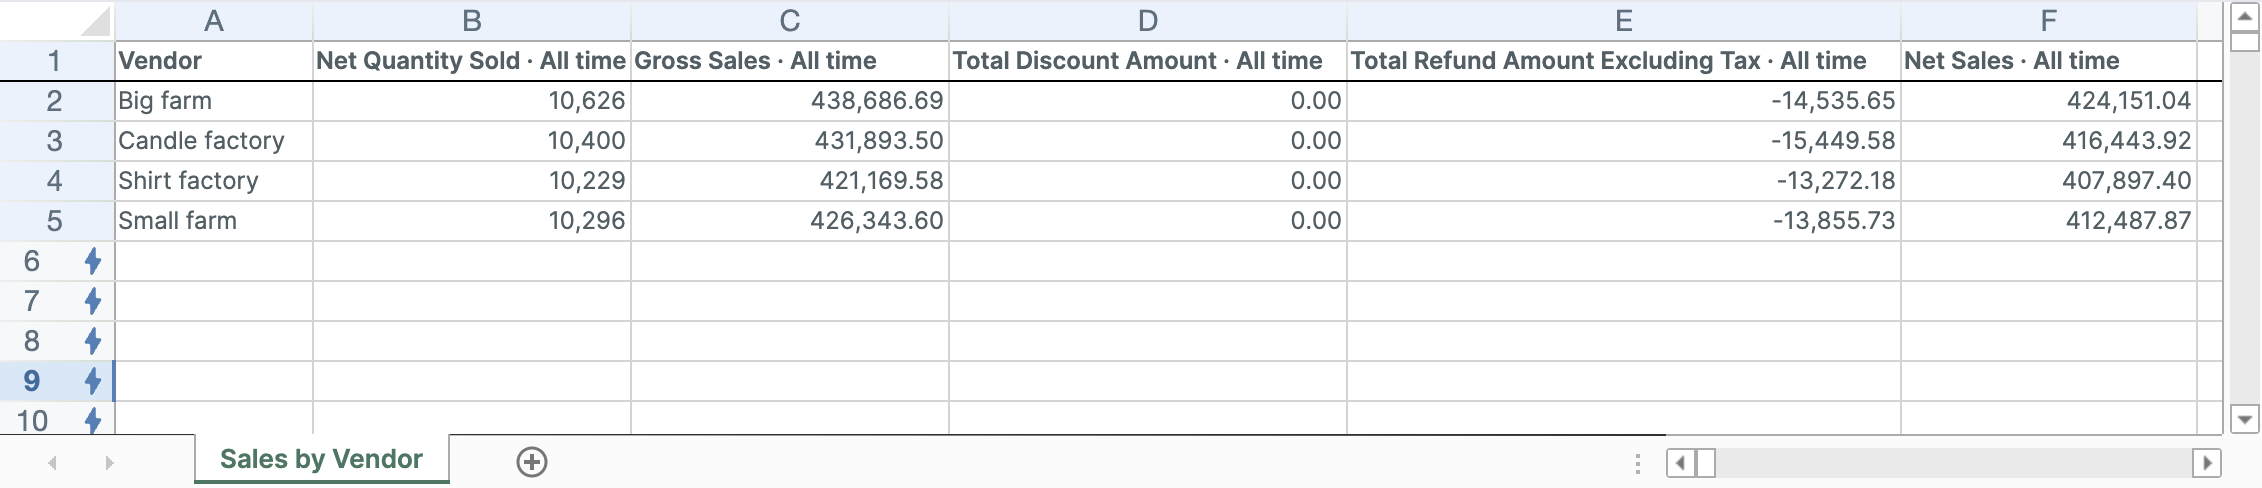
Create the Sales by Vendor spreadsheet
- Install Mixtable Analytics Spreadsheet
- Click Create Spreadsheet
- Search for or select Sales by Vendor
- Create the spreadsheet
Rank vendors responsibly
Net Sales is a useful starting point, but it does not explain the whole result. Compare:
- Gross Sales to see original demand
- Discounts to see promotion dependence
- Returns Excluding Tax to see refund impact
- Net Sales to see retained merchandise revenue
- Net Items Sold to understand volume
A vendor with high Gross Sales and much lower Net Sales may depend on discounts or generate substantial refund activity.
Add order and profitability context
Useful additions include:
- Orders Count
- Average Order Value
- Refunded Quantity
- Percent of Orders Refunded
- Cost of Goods Sold
- Gross Profit
- Gross Margin
Profit metrics require complete Shopify Cost per item data and use current variant costs.
Compare vendor trends
The template creates a lifetime Pivot Table worksheet. To see direction over time, add a Reporting worksheet and choose Vendor net sales by year, or create a Time Series worksheet with Vendor and monthly columns.
A vendor can lead lifetime sales while declining recently. Keep both the total and trend views before changing a supplier relationship.
Clean vendor names in Shopify
Mixtable creates one row per distinct vendor value. Differences in spelling, capitalization, or whitespace can split one supplier across several rows.
Standardize the Shopify vendor field before using the report for purchasing decisions. If you edit vendor values with Mixtable, review the pending changes and intentionally click Sync to Shopify.
For a guided added worksheet, see Shopify sales by product attributes.
Manage Shopify data in a spreadsheet.
Use Mixtable to edit, sync, analyze, import, and export your Shopify store data without CSV juggling.