
Shopify Refund Count Analytics
 Analytics Spreadsheet Updated October 2, 2026
 On this page
Refund Count is the number of distinct Shopify orders with refund activity for the row, timeframe, and filters you select.
How Shopify Refund Count is calculated
Refund Count = the number of distinct orders with refund activity
It is not the number of refund transactions, the number of returned units, or the number of return requests. An order refunded twice still counts once.
Why count refunds as well as measure them
Refund value tells you what refunds cost. Refund Count tells you how many orders they affect, and those two things can point in different directions.
A few expensive refunds and a steady stream of small ones produce very similar dollar totals, but they usually call for different investigation. You cannot tell them apart from the amount alone.
Use Refund Count to:
- Find the products and variants involved in the most refunded orders
- Give Percent of Orders Refunded its numerator, so a rate is traceable
- Judge whether one bad month was a single large refund or a broader pattern
- Compare vendors on how frequently their products end up in refunded orders
It counts orders, not refund transactions, refunded units, or support contacts. An order refunded twice still counts once. Use Refunded Quantity for units and Total Refund Amount Excluding Tax for monetary value.
Note: These metrics measure refunds recorded in Shopify. A refund does not always mean the goods came back, since orders can be refunded for damage, price adjustments, shipping problems, or goodwill without a physical return. Use Shopify’s return data when you need to know what was actually sent back.
Add Refund Count to a Shopify data worksheet
-
Open a supported Shopify data worksheet
-
Click + Shopify data in the header row of an empty column, or choose Column > Add Shopify data… from the menu bar. The field picker opens
-
Click Sales & analytics in the list of sections on the left, or type the metric's name in the search box
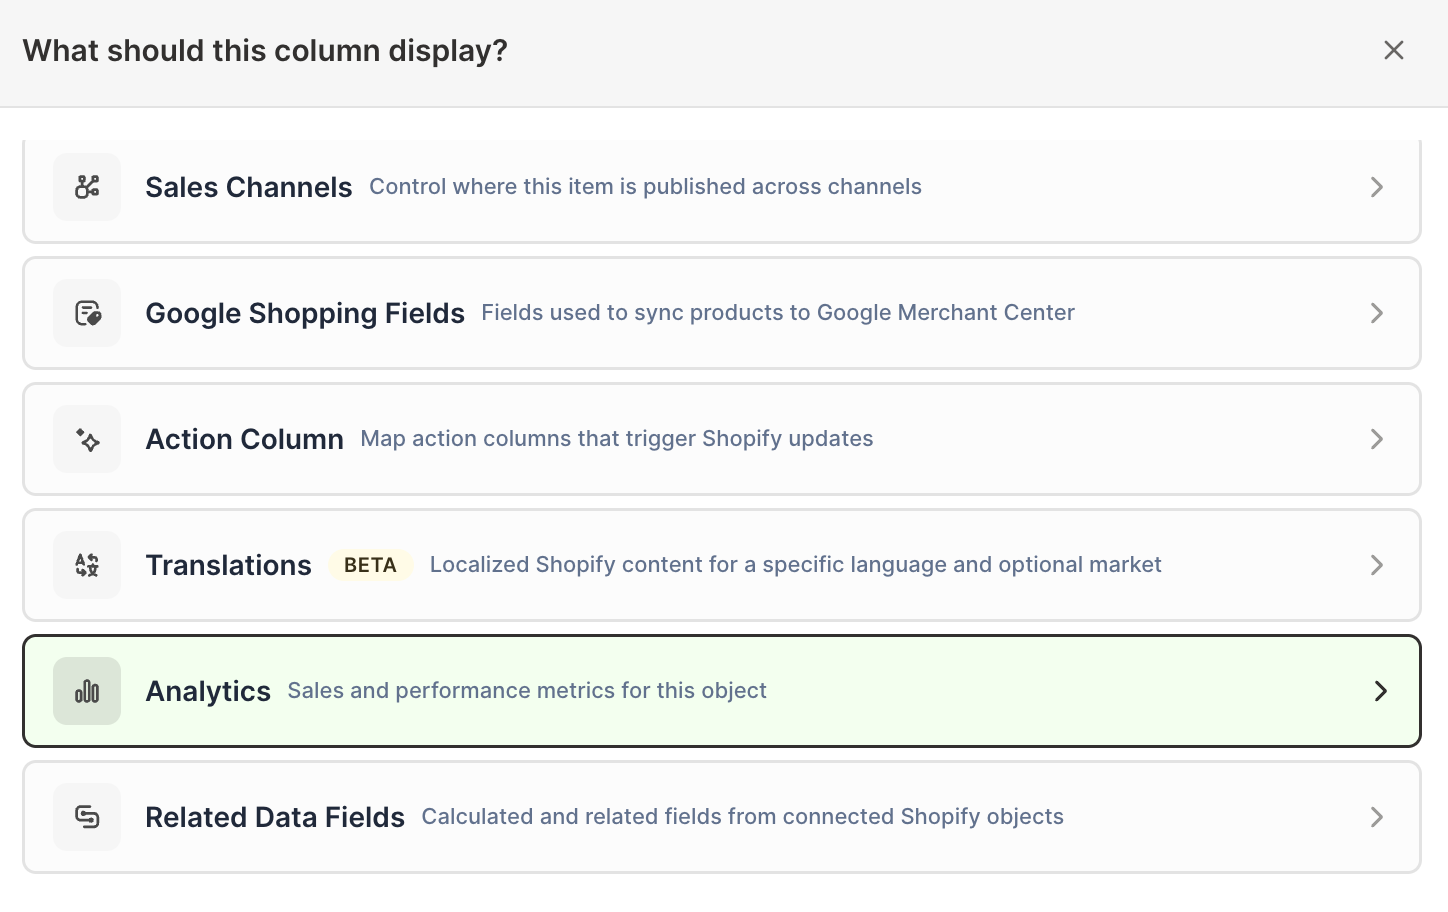
-
Click Refund Count. The metric's settings open with it already chosen under Which metric?
-
Under Over what time period?, choose All time, Fixed dates, Rolling period, Calendar year, or Calendar month
-
Under Limit which orders count, add any optional filters supported by the metric
-
Click Save Column
The metric is calculated in the context of each row. On a Product Variants worksheet, for example, it counts refunded orders associated with each variant, which is often the first place a problem specific to one size or color shows up.
Compare Refund Count with a Pivot Table worksheet
- Click the + button beside the worksheet tabs
- Select Reporting worksheet, then click Continue
- Select a ready-made report under Pivot table, or choose Blank pivot table, then click Continue
- Under Break down by, choose the breakdown
- Add Refund Count under Metrics
- Under Time period, choose the period
- Click Create Worksheet
Add Orders Count, Percent of Orders Refunded, Total Refund Amount Excluding Tax, and Refunded Quantity to see frequency and impact together. Ten refunds against 5,000 orders is noise; ten against 60 is a product to investigate this week.
Track store refund counts over time
When a Time Series worksheet uses Store as its breakdown, Refund Count can be added as a store metric and displayed by day, week, month, or year. That view is useful for spotting a rising refund trend early, while there is still time to look into what is behind it.
In the Time Series builder, Refund Count is offered only with Store rows. Time Series worksheets with other rows track one measure at a time:
- Market, customer segment, and marketing channel rows: Net Sales, Gross Sales, Orders Count, Net Quantity Sold, Total Refund Amount Excluding Tax, or Average Order Value
- Vendor and product type rows: Net Sales, Gross Sales, Orders Count, Net Quantity Sold, or Total Refund Amount Excluding Tax, plus the inventory measures listed under an Inventory heading
- Location rows: inventory measures only
To follow refunds by vendor, product type, market, customer segment, or marketing channel over time, measure Total Refund Amount Excluding Tax instead.