Shopify Orders Count Analytics
Shopify Orders Count Analytics
Orders Count is the number of distinct Shopify orders that contribute to a row or report group during the timeframe you choose.
How Shopify Orders Count is calculated
Orders Count = the number of distinct Shopify orders matching the row, timeframe, and filters
Each order is counted once no matter how many products, variants, or units it contains. That is the difference between Orders Count and the quantity metrics: one order holding twelve units counts as a single order and twelve units.
Why order counts change how you read revenue
Revenue alone never tells you how it was earned. A vendor doing $50,000 across 2,000 small orders is a completely different business from one doing $50,000 across 40 large ones: different shipping costs, different packing time, different support load, different risk if a few customers leave.
Orders Count supplies the missing half of that picture. Use it to:
- Tell whether growth came from more orders or from larger orders
- Find groups producing high fulfillment workload for modest revenue
- Spot revenue that depends on a handful of orders, which is fragile
- Give refund rates a denominator, so a percentage means something
Orders Count counts orders, not people. A repeat customer placing four orders contributes four, so use it to compare order volume rather than to size an audience.
The metric adapts to whatever the row represents. On a Products worksheet, it counts the orders containing each product. On a Customers worksheet, it counts orders associated with each customer. In a Pivot Table worksheet, it counts orders for each vendor, market, customer segment, or other selected breakdown.
Add Orders Count to a Shopify data worksheet
-
Open a supported Shopify data worksheet, then select an empty column or insert a new one. Empty columns have a non-green header; a green header means the column is already linked to Shopify data
-
Click the
 button in the column header
 -
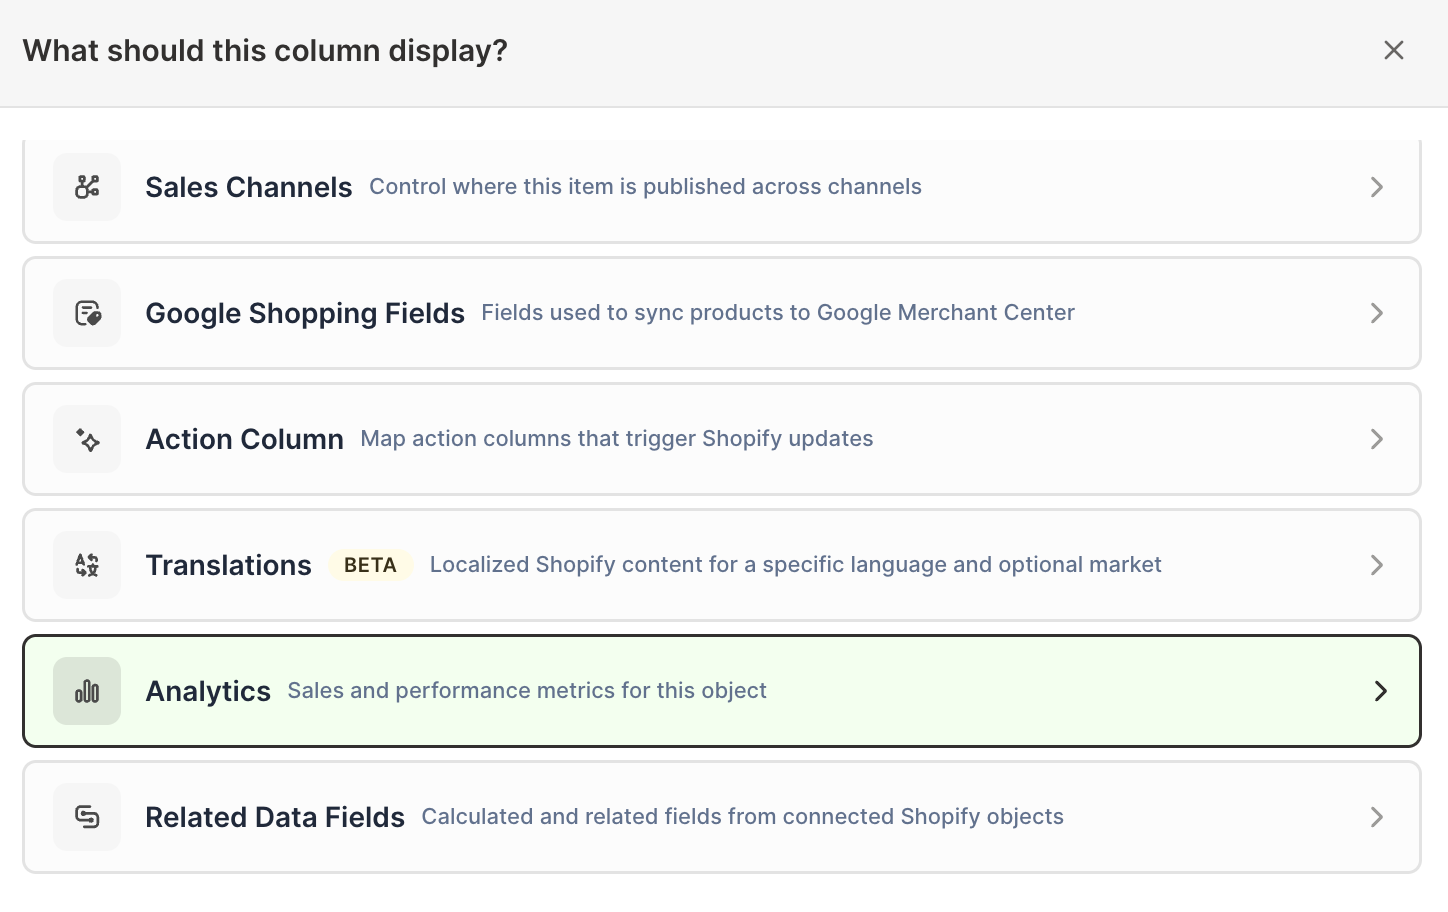
Choose Analytics
-
Under Which metric?, select Orders Count or Order Count, depending on the Shopify object
-
Under Over what time period?, choose All time, Fixed dates, Rolling period, Calendar year, or Calendar month
-
Under Limit which orders count, add any optional filters supported by the metric
-
Click Save Column
Filters turn this into a targeted count. Use them to answer questions such as how many orders came from a parent discount campaign, a fulfillment status, a Shopify Market, a B2B company, or a last-touch marketing source.
Compare order volume with a Pivot Table worksheet
- Click the + button beside the worksheet tabs
- Select Reporting worksheet
- Select a ready-made Pivot Table report, or choose Blank pivot table
- Choose the business dimension under Break down by
- Add Orders Count under Metrics
- Select the timeframe and optional filters
- Click Create Worksheet
Add Net Sales and Average Order Value beside it. Those three columns separate the groups that produce many small orders from the ones that produce fewer high-value orders, which usually deserve very different marketing and shipping treatment.
Track Orders Count over time
Orders Count is available in Time Series worksheets for store, vendor, product type, market, customer segment, and marketing channel reporting.
- Add an Reporting worksheet
- Choose a Time Series report, or select Blank time series
- Select the breakdown and Orders Count measure
- Choose monthly or yearly columns
- Click Create Worksheet
The Store sales and orders by month report is a useful ready-made starting point. Watching order count and net sales move together, or apart, is the quickest way to see whether your average order size is growing or shrinking.
Orders Count is not quantity sold
An order containing several products counts once for the store, but it can contribute to several product or collection rows. Use Gross Quantity Sold or Net Quantity Sold when you need unit counts instead.
Manage Shopify data in a spreadsheet.
Use Mixtable to edit, sync, analyze, import, and export your Shopify store data without CSV juggling.