


Shopify Refunded Quantity Analytics
Shopify Refunded Quantity Analytics
Refunded Quantity measures units associated with Shopify refund activity. It helps identify products and variants where the number of refunded units is meaningful even when the refund amount is small.
How Shopify Refunded Quantity is calculated
Refunded Quantity = the number of units attached to Shopify refund activity
It counts units, not orders and not return requests. One refunded order can contribute several units, and a return request that has not been refunded yet does not contribute at all.
Why count refunded units, not just refunded money
Refund amounts are dominated by price. A single expensive item can outweigh dozens of cheap ones, so a money-based view keeps pointing you at your premium products whether or not anything is wrong with them.
Counting units strips price out. That is what surfaces the low-priced product quietly going out and coming back over and over, costing you picking, packing, return shipping, and restocking time on every trip, while barely registering on a refund-amount report.
Refunded Quantity is the metric to use when you want to know:
- Which products and variants generate the most physical handling work after the sale
- How many units of a size or color you are really selling, once refunds are removed
- Whether a refund problem is broad across many units or concentrated in a few big-ticket orders
- How much of your stock is cycling out and back rather than staying sold
Read it beside Gross Quantity Sold and Net Quantity Sold. The three together show units ordered, units refunded, and units kept, which is the sequence you need before committing to a reorder.
Refunded Quantity and other return metrics
These metrics describe different events:
| Metric | What it measures |
|---|---|
| Refunded Quantity | Units associated with Shopify refund activity |
| Total Refund Amount | Money refunded |
| Refund Count | Distinct orders with refund activity |
| Percent of Orders Refunded | Share of relevant orders with refund activity |
| Return Quantity | Units recorded on Shopify return line items |
| Return Request Count | Shopify return requests |
A refund can exist without a physical return, and a return request can exist before a refund. Do not use Refunded Quantity as a substitute for Return Quantity when you are analyzing the return-management workflow.
Add Refunded Quantity to a Shopify data worksheet
-
Open a supported Product, Product Variant, Collection, Company, or Company Location worksheet, then select an empty column or insert a new one. Empty columns have a non-green header; a green header means the column is already linked to Shopify data
-
Click the
 button in the column header
 -
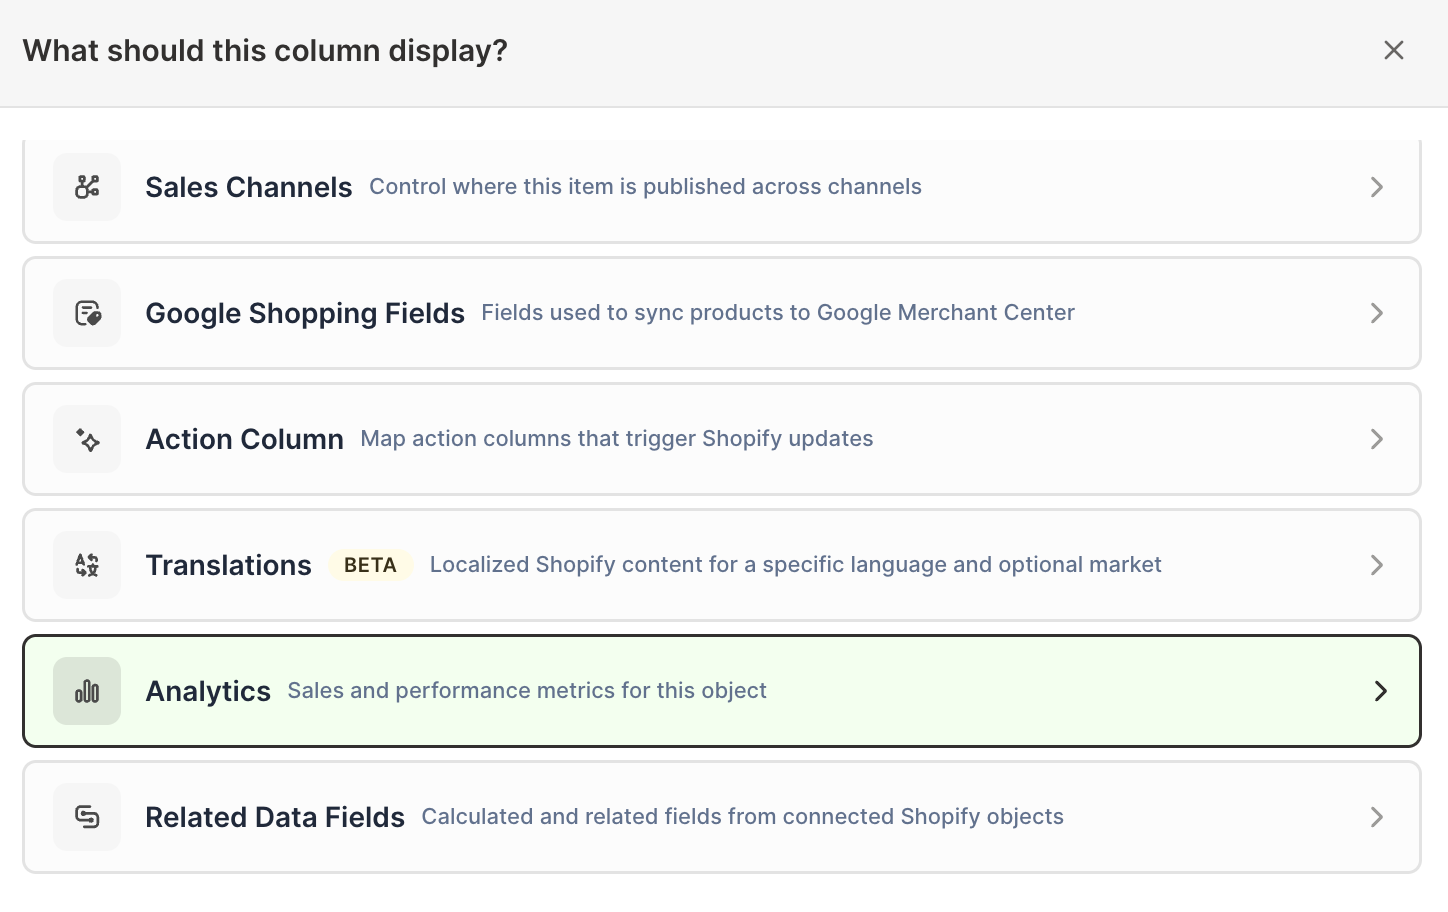
Choose Analytics
-
Under Which metric?, select Refunded Quantity
-
Under Over what time period?, choose All time, Fixed dates, Rolling period, Calendar year, or Calendar month
-
Under Limit which orders count, add any optional filters supported by the metric
-
Click Save Column
Add Gross Quantity Sold and Net Quantity Sold with the same dates and filters.
Compare refunded quantities with a Pivot Table worksheet
The Pivot Table worksheet builder includes Refunded Quantity in the Quantity metric group.
- Add an Reporting worksheet
- Choose a ready-made Pivot Table report or Blank pivot table
- Choose vendor, product type, product category, product tag, collection, Market, or customer segment
- Add Gross Quantity Sold, Refunded Quantity, and Net Quantity Sold
- Choose the timeframe
- Click Create Worksheet
This layout reveals whether refunded units are concentrated with a supplier, merchandise group, campaign tag, collection, Market, or customer audience.
Calculate a refunded-unit rate
Add a formula column such as:
Refunded Quantity / Gross Quantity Sold
Format the result as a percentage. This creates a unit-based ratio that is different from Percent of Orders Refunded, which uses orders rather than units.
Keep both the rate and the counts visible. A high rate on a small number of units is less conclusive than the same rate across large volume.
Use the Product Returns template
The Product Returns template creates one row per Shopify product with:
- Gross Quantity Ordered
- Returned Quantity, using the Refunded Quantity metric
- Return Rate, using Percent of Orders Refunded
The template’s historical labels use return language, but the underlying quantity and rate follow Shopify refund activity. Use Shopify Return Request Analytics when you need return-request status, reasons, open requests, or closure time.
Investigate the products behind the number
After finding a high Refunded Quantity:
- Compare the rate against Gross Quantity Sold
- Check whether one variant drives the product total
- Review Total Refund Amount to understand financial impact
- Compare earlier and recent timeframes
- Review return reasons where Shopify return data exists
- Check product descriptions, size information, images, packaging, and supplier quality
Quantity analytics finds where to look. Raw refund and return-line-item worksheets provide the individual records needed for detailed investigation.
Manage Shopify data in a spreadsheet.
Use Mixtable to edit, sync, analyze, import, and export your Shopify store data without CSV juggling.