


Add Analytics Columns to a Shopify Data Worksheet
Add Analytics Columns to a Shopify Data Worksheet
An analytics column calculates a Shopify performance metric for every row of a Shopify data worksheet. This lets you place Net Sales beside a product, Average Order Value beside a customer, or refund totals beside a B2B company without separating the Shopify records from the analysis.
Which worksheet type this is about
When you add a worksheet in Mixtable, you choose one of three types. Two of them involve Shopify analytics, and it helps to know which is which:
- Shopify data worksheet: one row per Shopify record, such as one product, one customer, or one collection. This is the type you add analytics columns to, and it is what this article covers
- Reporting worksheet: a report whose rows are groups you define, as either a Pivot Table worksheet (one row per vendor, category, Market, and so on) or a Time Series worksheet (one column per month or year)
- Basic worksheet: a blank spreadsheet with no Shopify connection
So there are two ways to get Shopify analytics. In a Reporting worksheet you decide what each row groups together, such as one row per vendor or per month. In a Shopify data worksheet your real Shopify records are the rows, and you add analytics columns beside them.
Within a Shopify data worksheet, the two kinds of column also do different jobs. Shopify data columns show stored fields such as title, vendor, SKU, status, email, or tags. Analytics columns calculate results from Shopify order activity for the timeframe and filters you choose.
Why put performance beside your Shopify records
Reports usually make you switch tools at the worst moment. You find a product selling out, then leave the report to go look up its stock, its cost, and its supplier somewhere else.
Analytics columns remove that step. Units sold sits next to units in stock, net sales sits next to cost per item, and lifetime spend sits next to the customer’s email. Everything the decision needs is on one row.
That is what makes this different from a standalone report:
- Sales beside inventory turns a ranking into a reorder list
- Sales beside cost shows which products are worth the shelf space
- Customer spend beside email and tags gives you a campaign list you can export as it stands
- Refund metrics beside product fields show which vendor’s products keep coming back
If you also use Mixtable Spreadsheet Editor, you can go further and edit the Shopify fields in the same worksheet, review your pending changes, and sync them. The report and the fix happen in one place.
When analytics columns are the best choice
Use analytics columns when you need one row per Shopify record and want to:
- Rank products or variants while keeping their SKU, price, cost, inventory, category, or status visible
- Compare customers while keeping names, emails, tags, and Shopify order counts beside the metrics
- Evaluate collections with their handles, product counts, and merchandising details
- Analyze B2B companies or company locations beside their operational data
- Add several timeframes or customer groups to the same worksheet
- Use formulas that combine Shopify fields and calculated performance metrics
Use a Pivot Table worksheet instead when you want one row per vendor, product category, tag, Market, or customer segment. Use a Time Series worksheet when months or years should be the columns.
Supported Shopify data worksheets
Analytics can be added directly to existing Product, Product Variant, Collection, Customer, Company, and Company Location worksheets. Available metrics vary by object type.
For example:
- Product and Collection worksheets focus on sales, quantities, discounts, refunds, fulfillment, and returns
- Product Variant worksheets add cost, profit, margin, and inventory context
- Customer worksheets add customer value, purchase interests, segments, attribution, and return activity
- Company and Company Location worksheets add B2B sales, quantities, charges, refunds, and order-value metrics
Mixtable only shows the analytics choices supported by the selected worksheet.
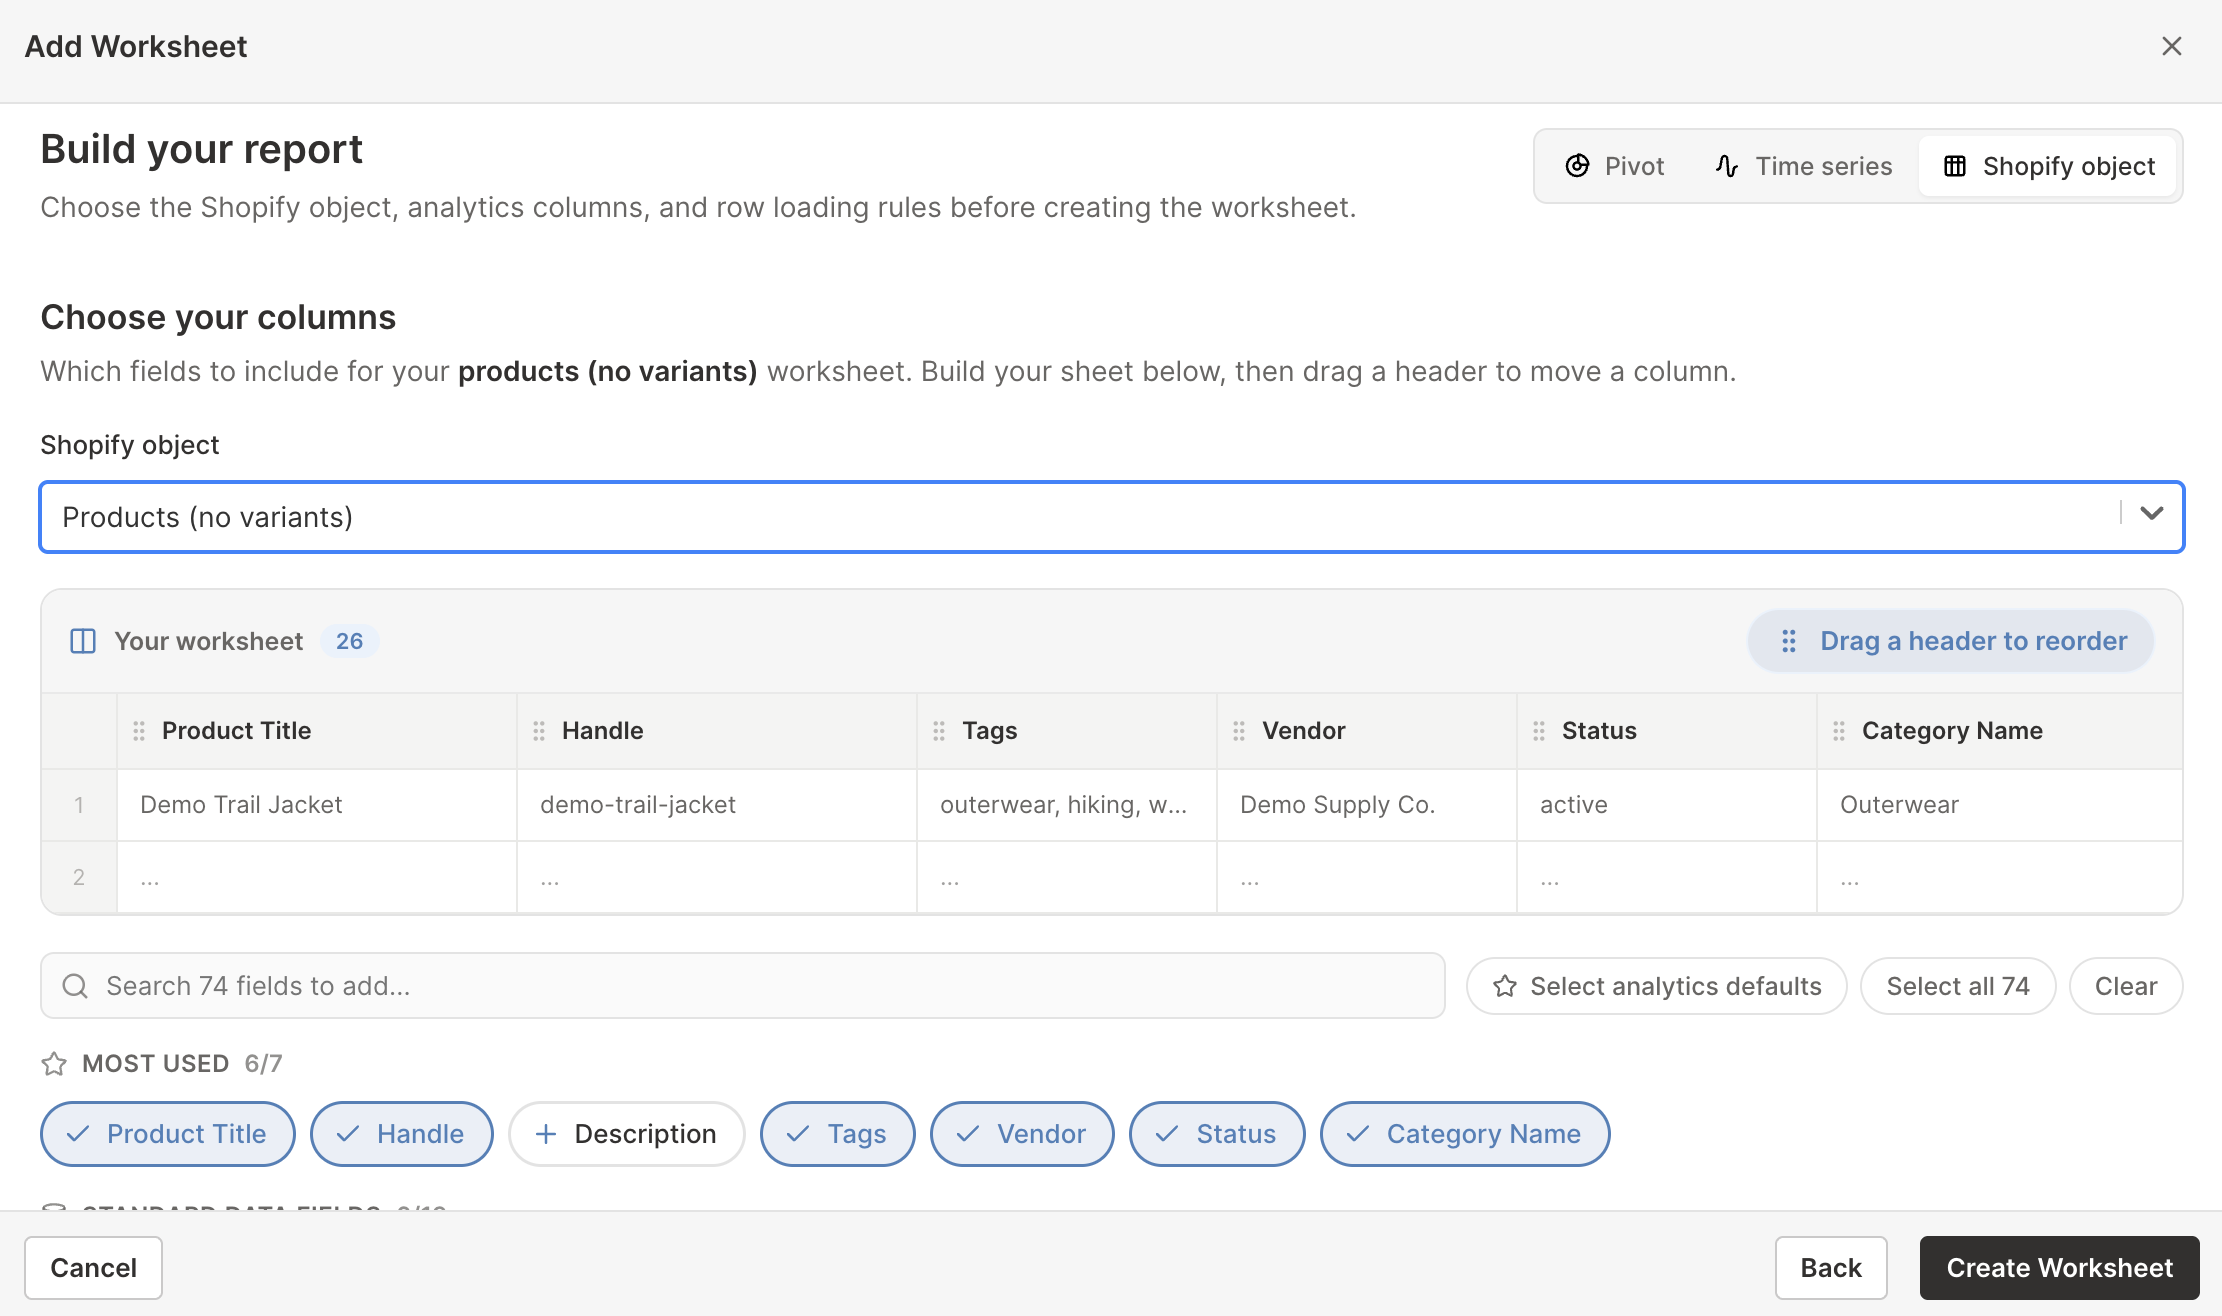
You can also create one of these worksheets from scratch with its analytics columns already chosen. In the report builder, select Shopify object, pick the object, then use Select analytics defaults to add a sensible starting set of metric columns beside the Shopify fields.
Add an analytics column
-
Open a supported Shopify data worksheet, then select an empty column or insert a new one. Empty columns have a non-green header; a green header means the column is already linked to Shopify data
-
Click the
 button in the column header
 -
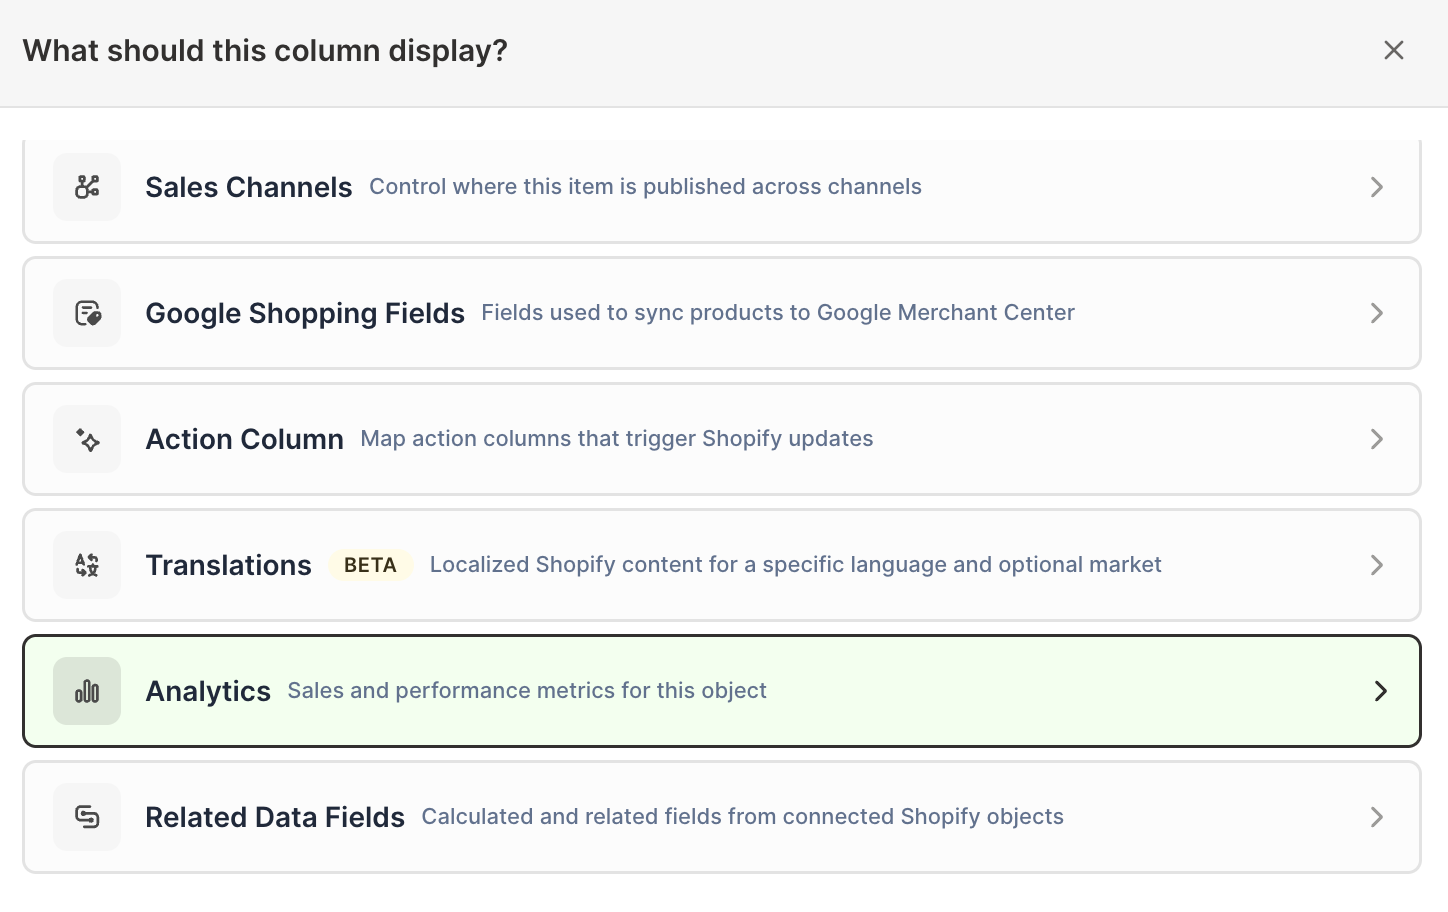
Choose Analytics
-
Under Which metric?, select the value you want to calculate
-
Under Over what time period?, choose All time, Fixed dates, Rolling period, Calendar year, or Calendar month
-
Under Limit which orders count, add any optional filters supported by the metric
-
Click Save Column
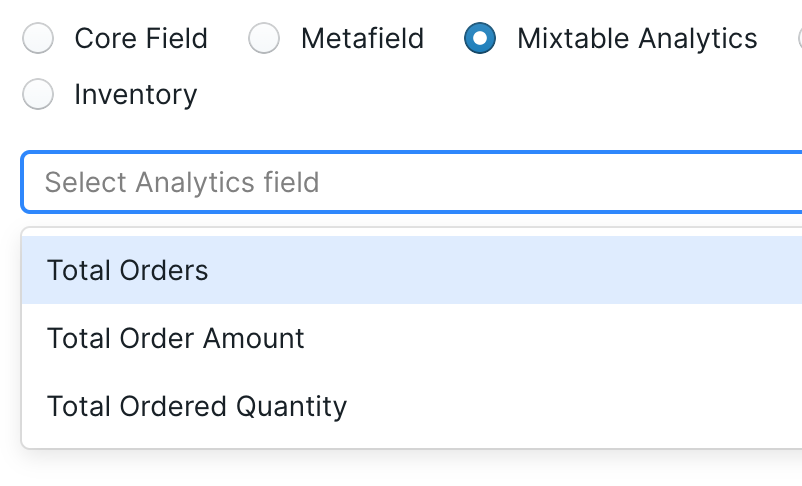
The column calculates the metric separately for every Shopify object row. A Net Sales column on a Products worksheet shows each product’s Net Sales. The same metric on a Customers worksheet shows the Net Sales associated with each customer.
Choose the timeframe
Every analytics column has its own timeframe:
- All time uses the available Shopify analytics history
- Fixed dates uses a start date and an optional inclusive end date
- Rolling period moves automatically based on today
- Calendar year uses a selected January-to-December year
- Calendar month uses a selected calendar month
Because each column is independent, you can add Net Sales for this year, last year, and the last 30 days to the same product worksheet. See Shopify analytics timeframes for detailed guidance.
Limit which Shopify orders count
Filters turn a broad metric into a specific business question. Depending on the metric and worksheet, you may be able to limit results by:
- Customer segment or customer country
- Orders with discounts or repeat customers
- Parent Shopify discount campaign
- Fulfillment status
- B2B or B2C order type
- B2B company or company location
- Order source, app, publication, or retail location
- First-touch or last-touch attribution values
- Fulfillment service, location, status, or tracking company
- Return status or return reason
For example, add Net Sales twice with the same timeframe, then filter one column to B2B orders and the other to B2C orders. The two columns create a direct channel comparison for every row.
See filter Shopify analytics reports for the full workflow.
Create useful column sets
Product performance
Add:
- Net Sales
- Net Quantity Sold
- Orders Count
- Total Refund Amount Excluding Tax
- Return Request Rate
This set separates products that sell well from products that generate a disproportionate amount of after-sale work.
Variant profitability
Add:
- Cost of Goods Sold
- Gross Profit
- Gross Margin
- Net Sales
- Net Quantity Sold
Keep current price, cost per item, and inventory fields beside the metrics. Shopify does not provide the historical cost per item on each order, so Mixtable’s profitability calculations use the current variant cost.
Customer activity
Add:
- Total Sales or Net Sales for all time
- Net Sales for the last 12 months
- Orders Count
- Average Order Value
- Total Refund Amount Excluding Tax
The lifetime and recent columns help distinguish currently active customers from customers whose strongest purchases happened much earlier.
Rename analytics columns clearly
The calculation settings are stored with the column, but a clear header makes the worksheet easier to understand. Include the metric, timeframe, and important filter in the name, for example:
Net Sales · 2026Net Sales · Last 30 daysOrders Count · B2BRefund Amount · VIP customers
Clear names are especially important when you export the spreadsheet or share it with someone who did not configure the report.
Analytics values and Shopify edits
Analytics columns are calculated values. You do not type over them or sync them to Shopify. The ordinary Shopify data fields beside them can still support editing where that object and field are editable.
When you change an editable Shopify field, follow the normal Mixtable workflow: review the pending changes, then intentionally click Sync to Shopify. Analytics results do not create Shopify changes.
For a preconfigured combination of Shopify fields and metrics, see the ready-made Shopify analytics report library.
Manage Shopify data in a spreadsheet.
Use Mixtable to edit, sync, analyze, import, and export your Shopify store data without CSV juggling.