
Shopify Average Order Value Analytics
 Analytics Spreadsheet Updated October 2, 2026
 On this page
- How Shopify Average Order Value is calculated
- Why Average Order Value matters
- What Average Order Value measures
- Add Average Order Value to a Shopify data worksheet
- Compare Average Order Value with a Pivot Table worksheet
- Track Average Order Value over time
- Filter Average Order Value
- Avoid misleading averages
- Average Order Value and Customer Lifetime Value
Average Order Value shows the average discounted product sales value, excluding tax, across the relevant Shopify orders. It helps explain whether growth comes from more orders, larger orders, or both.
How Shopify Average Order Value is calculated
Average Order Value = Discounted product sales excluding tax ÷ Orders Count
Because the numerator leaves out tax, shipping, duties, and fees, Average Order Value describes the merchandise value of a typical order rather than the total amount the customer paid.
Why Average Order Value matters
Growing revenue has only two sources: more orders, or bigger orders. Average Order Value tells you which one you actually got, and the answer changes what you should do next.
If revenue is up because order count is up, your marketing is working and the question becomes whether you can fulfil the volume. If revenue is up because Average Order Value is up, something in your merchandising is working: bundles, free-shipping thresholds, cross-sells, or a shift toward pricier products. Those need very different follow-up.
Average Order Value also tells you:
- Which customer segments and B2B accounts place the orders worth having
- Whether a free-shipping threshold is actually lifting basket size
- Which acquisition channels bring browsers and which bring buyers
- How much room you have on shipping costs, since a $40 order and a $400 order tolerate very different shipping spend
Always read it beside Orders Count. A high average across nine orders is a different business result from the same average across nine thousand.
What Average Order Value measures
Mixtable calculates Average Order Value from eligible Shopify product sales after discounts and excluding taxes, divided by the relevant distinct order count.
It is not:
- Average product price
- Average unit price
- Total Sales divided by orders when Total Sales includes shipping, taxes, duties, and fees
- Customer lifetime spend
- Profit per order
Add Average Order Value to a Shopify data worksheet
-
Open a supported Customer, Company, or Company Location worksheet
-
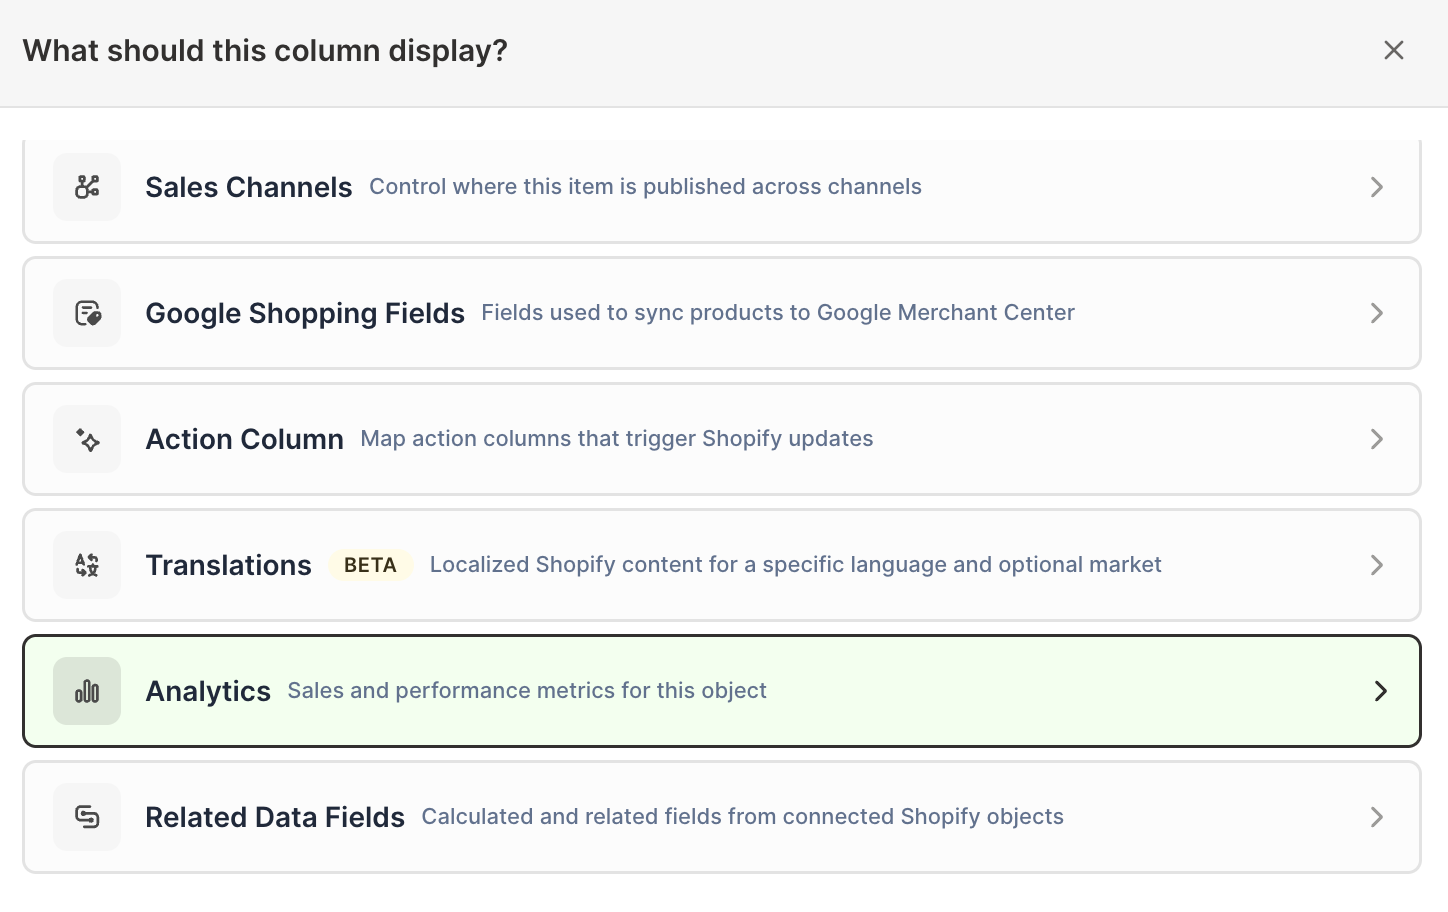
Click + Shopify data in the header row of an empty column, or choose Column > Add Shopify data… from the menu bar. The field picker opens
-
Click Sales & analytics in the list of sections on the left, or type the metric's name in the search box
-
Click Average Order Value. The metric's settings open with it already chosen under Which metric?
-
Under Over what time period?, choose All time, Fixed dates, Rolling period, Calendar year, or Calendar month
-
Under Limit which orders count, add any optional filters supported by the metric
-
Click Save Column
Add Order Count and Net Sales beside the new column so the average has its volume and value context.
Compare Average Order Value with a Pivot Table worksheet
The Customer segment contribution report includes Average Order Value beside orders, sales, discounts, and refunds.
Pivot Table worksheets can show Average Order Value on Market and customer-segment rows. Rows that group products, such as one row per vendor, product type, product category, or product tag, show N/A for it.
Use it to answer:
- Which customer segments place larger orders?
- Which Shopify Markets have higher basket value?
- Do heavily discounted groups actually produce larger baskets?
Track Average Order Value over time
When a Time Series worksheet uses Store, Average Order Value can become a row with recent daily, weekly, monthly, or yearly columns.
For Market, customer segment, or marketing channel breakdowns, Average Order Value can be the single measure tracked across time. Vendor and product type rows show N/A for it.
This helps separate two kinds of growth:
- Orders Count rises while Average Order Value stays stable, which points to more transactions
- Average Order Value rises while Orders Count stays stable, which points to larger baskets
Add Net Sales when you need to see the combined result.
Filter Average Order Value
Depending on the worksheet, filters can include:
- Orders with a discount
- Fulfillment status
- Order source, app, publication, or retail location
- Parent discount campaign
- First-touch or last-touch attribution values
- Customer segment, customer’s country, or repeat customers, on Company and Company Location worksheets only
Average Order Value has no order type, company, or company location filter. To see the order values of your B2B accounts, add it to a Company or Company Location worksheet, where every row is a B2B account.
Matched filtered columns make useful comparisons. For example, compare Average Order Value for all orders with Average Order Value for orders that used a discount, or for two last-touch marketing sources, using the same timeframe.
Avoid misleading averages
Before acting on Average Order Value:
- Check Orders Count for sample size
- Compare the same timeframe and filters
- Review refunds and discounts
- Remember that a few large orders can move the average
- Compare with average gross and net quantities when basket unit count matters
For skewed customer groups, also sort individual customer Total Sales and Order Count. A segment average can hide very different behavior among its members.
Average Order Value and Customer Lifetime Value
These two metrics answer different questions. Average Order Value describes the size of a typical order in revenue terms. Customer Lifetime Value measures profit per customer: their Net Sales excluding tax, minus the estimated cost of the goods they bought.
Reading them together is useful, because they can move in opposite directions. A promotion that bundles more items into each order lifts Average Order Value, while Customer Lifetime Value falls if the extra volume arrives at a thinner margin.
Use Average Order Value when you want average order size, Customer Lifetime Value when you want customer profit, and Net Sales or Total Sales with an All time timeframe when you want cumulative customer spend.
See Shopify Customer Analytics for customer-level reporting.