


Shopify Net Quantity Sold Analytics
Shopify Net Quantity Sold Analytics
Net Quantity Sold is the number of units your customers ordered and kept: quantity ordered, minus quantity returned.
How Shopify Net Quantity Sold is calculated
Net Quantity Sold = Gross Quantity Sold - Returned quantity
It counts units rather than orders. Use Net Quantity Sold when you want to know how much product customers actually kept, and Gross Quantity Sold when you want original demand.
Why unit counts matter as much as revenue
Sales figures are shaped by price. Two products with identical Net Sales can be very different businesses if one sold ten units at $100 and the other sold a thousand at $1. Net Quantity Sold strips price out and tells you how much product actually moved and stayed sold.
That makes it the right metric for the decisions that involve physical goods:
- Reordering and purchasing, where you buy units rather than dollars
- Sizing and color assortment, where you need to know which options customers keep
- Warehouse and packing capacity planning
- Judging whether a discount grew real volume or just moved the same units at a lower price
Compare it with Gross Quantity Sold and Refunded Quantity to separate original demand from returns. A large gap between the two is worth investigating before you reorder, since fit, quality, and product descriptions are common explanations but the metrics do not identify which applies.
Add Net Quantity Sold to a Shopify data worksheet
-
Open a supported Shopify data worksheet, then select an empty column or insert a new one. Empty columns have a non-green header; a green header means the column is already linked to Shopify data
-
Click the
 button in the column header
 -
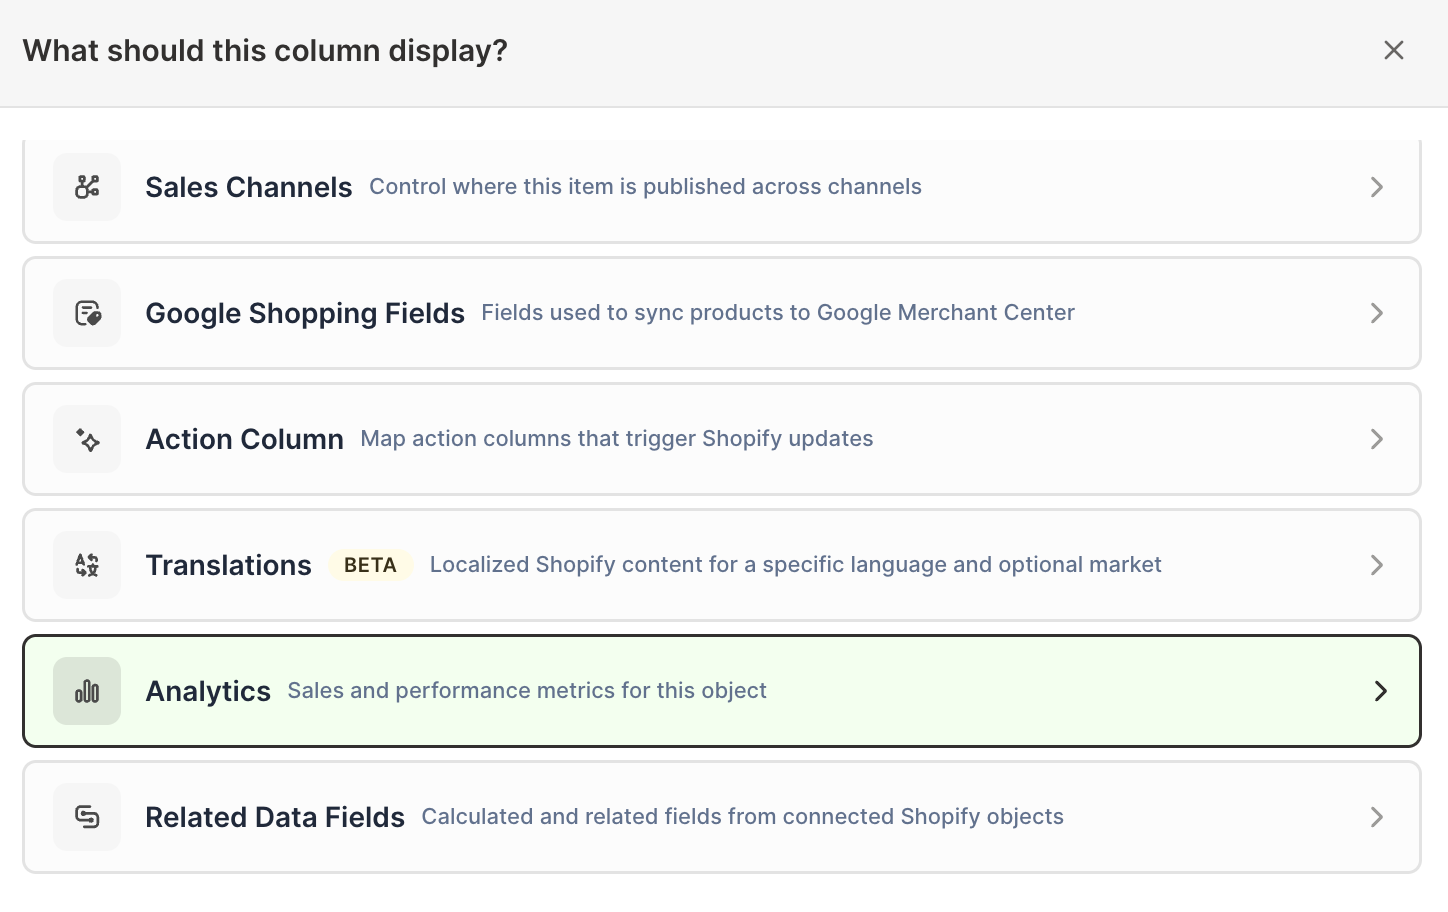
Choose Analytics
-
Under Which metric?, select Net Quantity Sold
-
Under Over what time period?, choose All time, Fixed dates, Rolling period, Calendar year, or Calendar month
-
Under Limit which orders count, add any optional filters supported by the metric
-
Click Save Column
Mixtable calculates the metric for each row, so you can keep Shopify fields such as product title, variant SKU, vendor, category, price, cost, and inventory beside the result. Units sold next to units in stock is the pairing that makes a reorder decision obvious.
Compare Net Quantity Sold with a Pivot Table worksheet
- Click the + button beside the worksheet tabs
- Select Reporting worksheet
- Select a ready-made Pivot Table report, or choose Blank pivot table
- Choose a breakdown such as vendor, product type, product category, product tag, market, or customer segment
- Add Net Quantity Sold under Metrics
- Choose the timeframe and optional filters
- Click Create Worksheet
This produces one row per selected dimension, which makes it easy to rank groups by retained unit volume rather than by revenue.
Track Net Quantity Sold over time
Seasonality shows up in units long before it shows up in your bank balance. A Time Series worksheet gives you the month-by-month pattern you need for buying decisions.
- Add an Reporting worksheet
- Choose a Time Series report, or select Blank time series
- Select the breakdown
- Choose Net Quantity Sold as the measure
- Select monthly or yearly periods
- Click Create Worksheet
Read negative values correctly
Net Quantity Sold can drop below zero for a period when more units are returned in that period than were sold during it, which typically happens after a big month followed by a wave of returns. Check the result against Gross Quantity Sold and Refunded Quantity before treating a negative number as a data problem.
Manage Shopify data in a spreadsheet.
Use Mixtable to edit, sync, analyze, import, and export your Shopify store data without CSV juggling.