
Shopify Inventory Analytics
 Analytics Spreadsheet Updated October 8, 2026
 On this page
- What inventory analytics can answer
- Where the numbers come from
- The 18 inventory metrics
- Where you can add inventory metrics
- Add an inventory metric as an analytics column
- Add inventory metrics to a Pivot Table worksheet
- Add inventory metrics to a Time Series worksheet
- Which report rows can show inventory metrics
- How totals add up
- Date rules
- The inventory history download
- What the cells can say
- What the metrics need to be accurate
- Inventory metrics are not a live stock count
Your Shopify admin tells you how much stock you have right now. Inventory analytics in Mixtable Analytics Spreadsheet tells you how you got there: how much you had on a past day, what it was worth, how often each variant sold out, and which products sell through while others sit on the shelf.
Mixtable downloads your store’s day-by-day stock history from Shopify and calculates 18 inventory metrics from it. You can add them as columns beside every variant, product, or collection, or total them by vendor, product type, stock location, or for the whole store in a Reporting worksheet.
What inventory analytics can answer
- How much stock did we have at the end of last month or last year, and what was it worth at cost?
- Which variants keep selling out, and for how many days at a time?
- What did those stockouts probably cost us in sales?
- Which products sell through quickly, and which barely move?
- How many days will the current stock last at the recent sales pace?
- How much stock, and how much money, is tied up in variants that sold nothing?
- Which locations hold the most stock, and how is that changing month by month?
Where the numbers come from
For every variant that tracks inventory in Shopify, Mixtable downloads the stock at each of your locations at the end of each day. The stock is the quantity Shopify shows as Available, so units committed to orders, units marked as unavailable, and incoming units aren’t part of it.
Shopify keeps this history from October 1, 2023, so that is as far back as the metrics go. Mixtable stores the history and calculates every metric itself. The metrics that compare stock with sales also use the Net Sales and Net Quantity Sold that Mixtable calculates from your Shopify orders, over the same days, so they match your sales columns.
Days follow your store’s time zone, and a day’s stock is what was left when that day ended.
Inventory values use each variant’s cost per item and price as they stood at the end of that day. Mixtable keeps its own record of those changes, so for days before it started recording, it uses the earliest values it has.
The 18 inventory metrics
The metrics fall into three families. Each family has its own article with the calculations and worked examples.
Stock levels and inventory value
| Metric | What it shows |
|---|---|
| Opening Stock | Units in stock at the start of the day or period |
| Closing Stock | Units in stock at the end of the day or period |
| Stock Change | Closing Stock minus Opening Stock |
| Average Daily Stock | The average number of units in stock per day over the period |
| Closing Value at Cost | What the closing stock cost you, at each variant’s cost per item |
| Closing Value at Retail | What the closing stock would sell for at each variant’s price |
| Units Without Cost | Units in the closing stock that have no cost per item, so the cost value leaves them out |
See Shopify stock levels and inventory value.
Stockouts and availability
| Metric | What it shows |
|---|---|
| Days In Stock | Days the variant ended with stock |
| Days Out of Stock | Days the variant ended at zero or below |
| In-Stock Rate | The share of days the variant ended with stock |
| Out-of-Stock Variants | How many variants were out of stock at the end of the day |
| Last In-Stock Date | The last day the variant ended with stock |
| Estimated Lost Sales | The Net Sales a variant probably missed while it was out of stock |
See Shopify stockouts and in-stock rate.
Sell-through, turnover, and dead stock
| Metric | What it shows |
|---|---|
| Sell-Through Rate | Units sold as a share of units sold plus the stock left at the end |
| Inventory Turnover | Units sold during the period divided by Average Daily Stock |
| Days of Stock Left | How many days the closing stock lasts at the pace the variant sold on its in-stock days during the period |
| Dead Stock Units | Stock left at the end on variants that sold nothing during the period |
| Dead Stock Value at Cost | What that dead stock cost you |
See Shopify sell-through rate, inventory turnover, and dead stock.
Where you can add inventory metrics
There are two places to use inventory metrics:
- Analytics columns on a Shopify data worksheet: a Products (with variants) worksheet (one row per variant), a Products (no variants) worksheet (one row per product), or a Collections worksheet
- Reporting worksheets: a Pivot Table worksheet or a Time Series worksheet, whose rows group products by vendor, product type, product category, or product tag, show one stock location each, or (in a Time Series worksheet) total the whole store
Not every metric fits every row. Days In Stock, Days Out of Stock, and Days of Stock Left are counted per variant, so only variant rows have them. Out-of-Stock Variants counts variants, so it needs a row that holds several. And because sales aren’t split by stock location, Location rows leave out the metrics that compare stock with sales.
In the table below, Report rows are Pivot Table and Time Series rows for a vendor, product type, product category, or product tag, and Store rows.
| Metric | Variants | Products | Collections | Report rows | Location rows |
|---|---|---|---|---|---|
| Opening Stock | Yes | Yes | Yes | Yes | Yes |
| Closing Stock | Yes | Yes | Yes | Yes | Yes |
| Stock Change | Yes | Yes | Yes | Yes | Yes |
| Average Daily Stock | Yes | Yes | Yes | Yes | Yes |
| Closing Value at Cost | Yes | Yes | Yes | Yes | Yes |
| Closing Value at Retail | Yes | Yes | Yes | Yes | Yes |
| Units Without Cost | Yes | Yes | Yes | Yes | Yes |
| Days In Stock | Yes | No | No | No | No |
| Days Out of Stock | Yes | No | No | No | No |
| In-Stock Rate | Yes | Yes | Yes | Yes | Yes |
| Out-of-Stock Variants | No | Yes | Yes | Yes | Yes |
| Last In-Stock Date | Yes | Yes | No | No | No |
| Days of Stock Left | Yes | No | No | No | No |
| Estimated Lost Sales | Yes | Yes | Yes | Yes | No |
| Sell-Through Rate | Yes | Yes | Yes | Yes | No |
| Inventory Turnover | Yes | Yes | Yes | Yes | No |
| Dead Stock Units | Yes | Yes | Yes | Yes | Yes |
| Dead Stock Value at Cost | Yes | Yes | Yes | Yes | Yes |
That makes 17 metrics on a Products (with variants) worksheet, 15 on a Products (no variants) worksheet, 14 on a Collections worksheet and on report rows, and 11 on Location rows.
Add an inventory metric as an analytics column
An analytics column puts an inventory metric right beside the Shopify fields you already work with, such as SKU, price, vendor, and tags. These steps differ from the ones for sales metrics: inventory metrics ask for dates in their own way and filter by stock location instead of by order.
-
Open a Products (with variants), Products (no variants), or Collections worksheet. To add one, click the + at the end of the worksheet tabs, or choose Worksheet > Add worksheet…
-
Click + Shopify data in the header row of an empty column, or choose Column > Add Shopify data… from the menu bar. The field picker opens
-
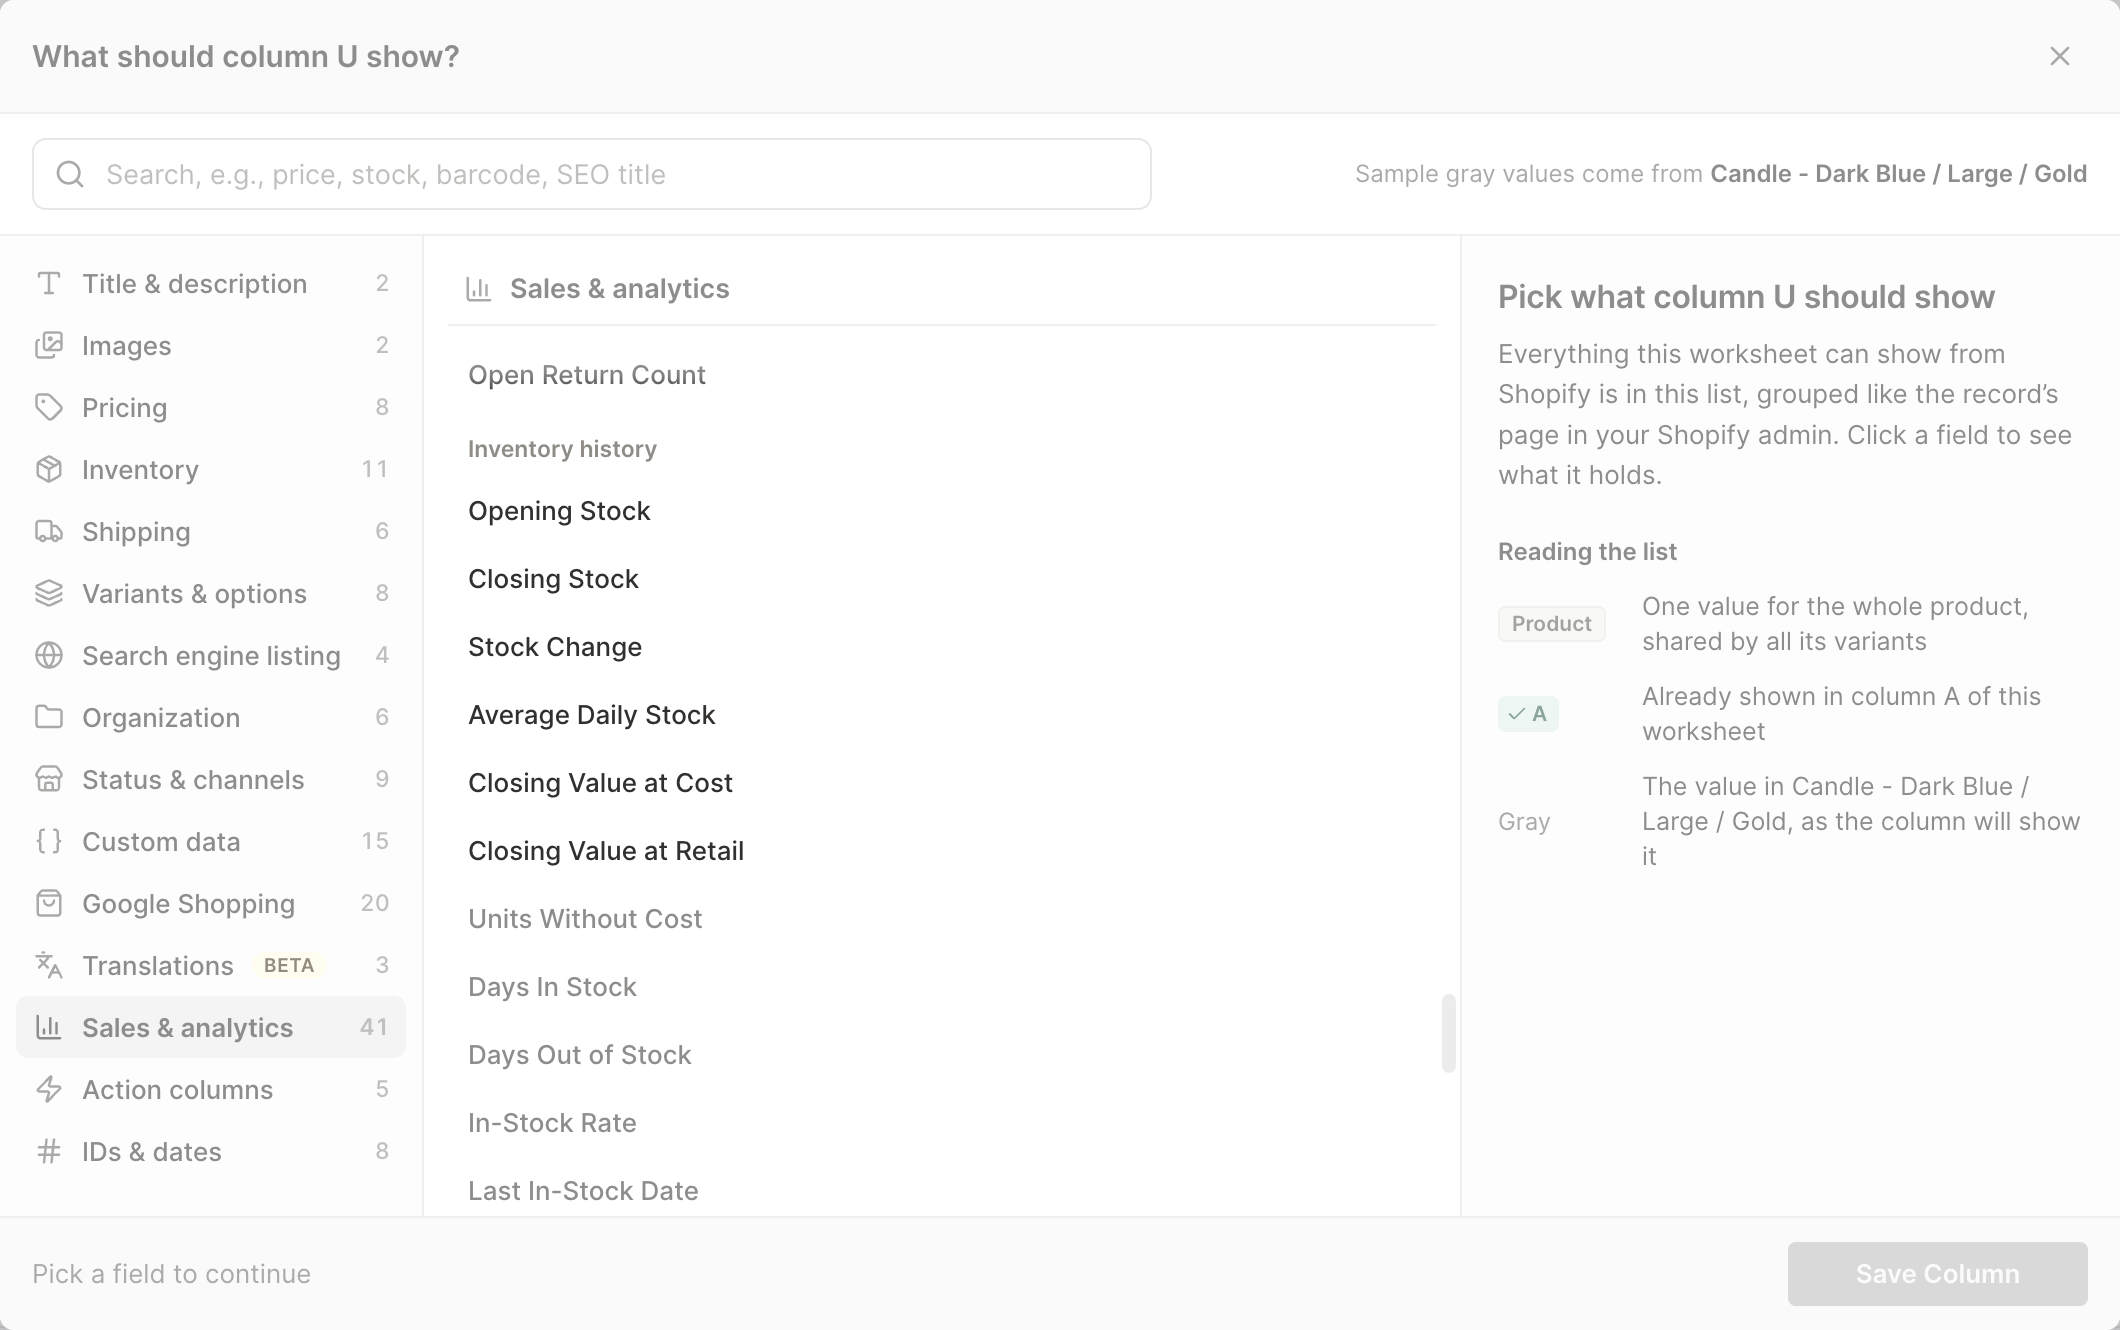
Click Sales & analytics in the list of sections on the left, then scroll down to the Inventory history group. You can also type part of the metric's name in the search box
-
Click a metric such as Closing Stock. The metric's settings open with it already chosen under Which metric?
-
Pick the dates. Most metrics ask Over what time period?: choose Fixed dates, Rolling period, Calendar year, or Calendar month, then pick the dates. Metrics that describe a single day ask On what date? instead: choose Fixed date, Rolling date, Calendar year, or Calendar month, then pick the day
-
Under Which stock locations count, leave it as it is to count every location. To count only some, click + Add filter, choose Stock location, and pick a location. Click + Add filter again to add another one. Days of Stock Left, Estimated Lost Sales, Sell-Through Rate, and Inventory Turnover always count every location, because sales aren't split by stock location, so this step has nothing to pick for them
-
Click Save Column
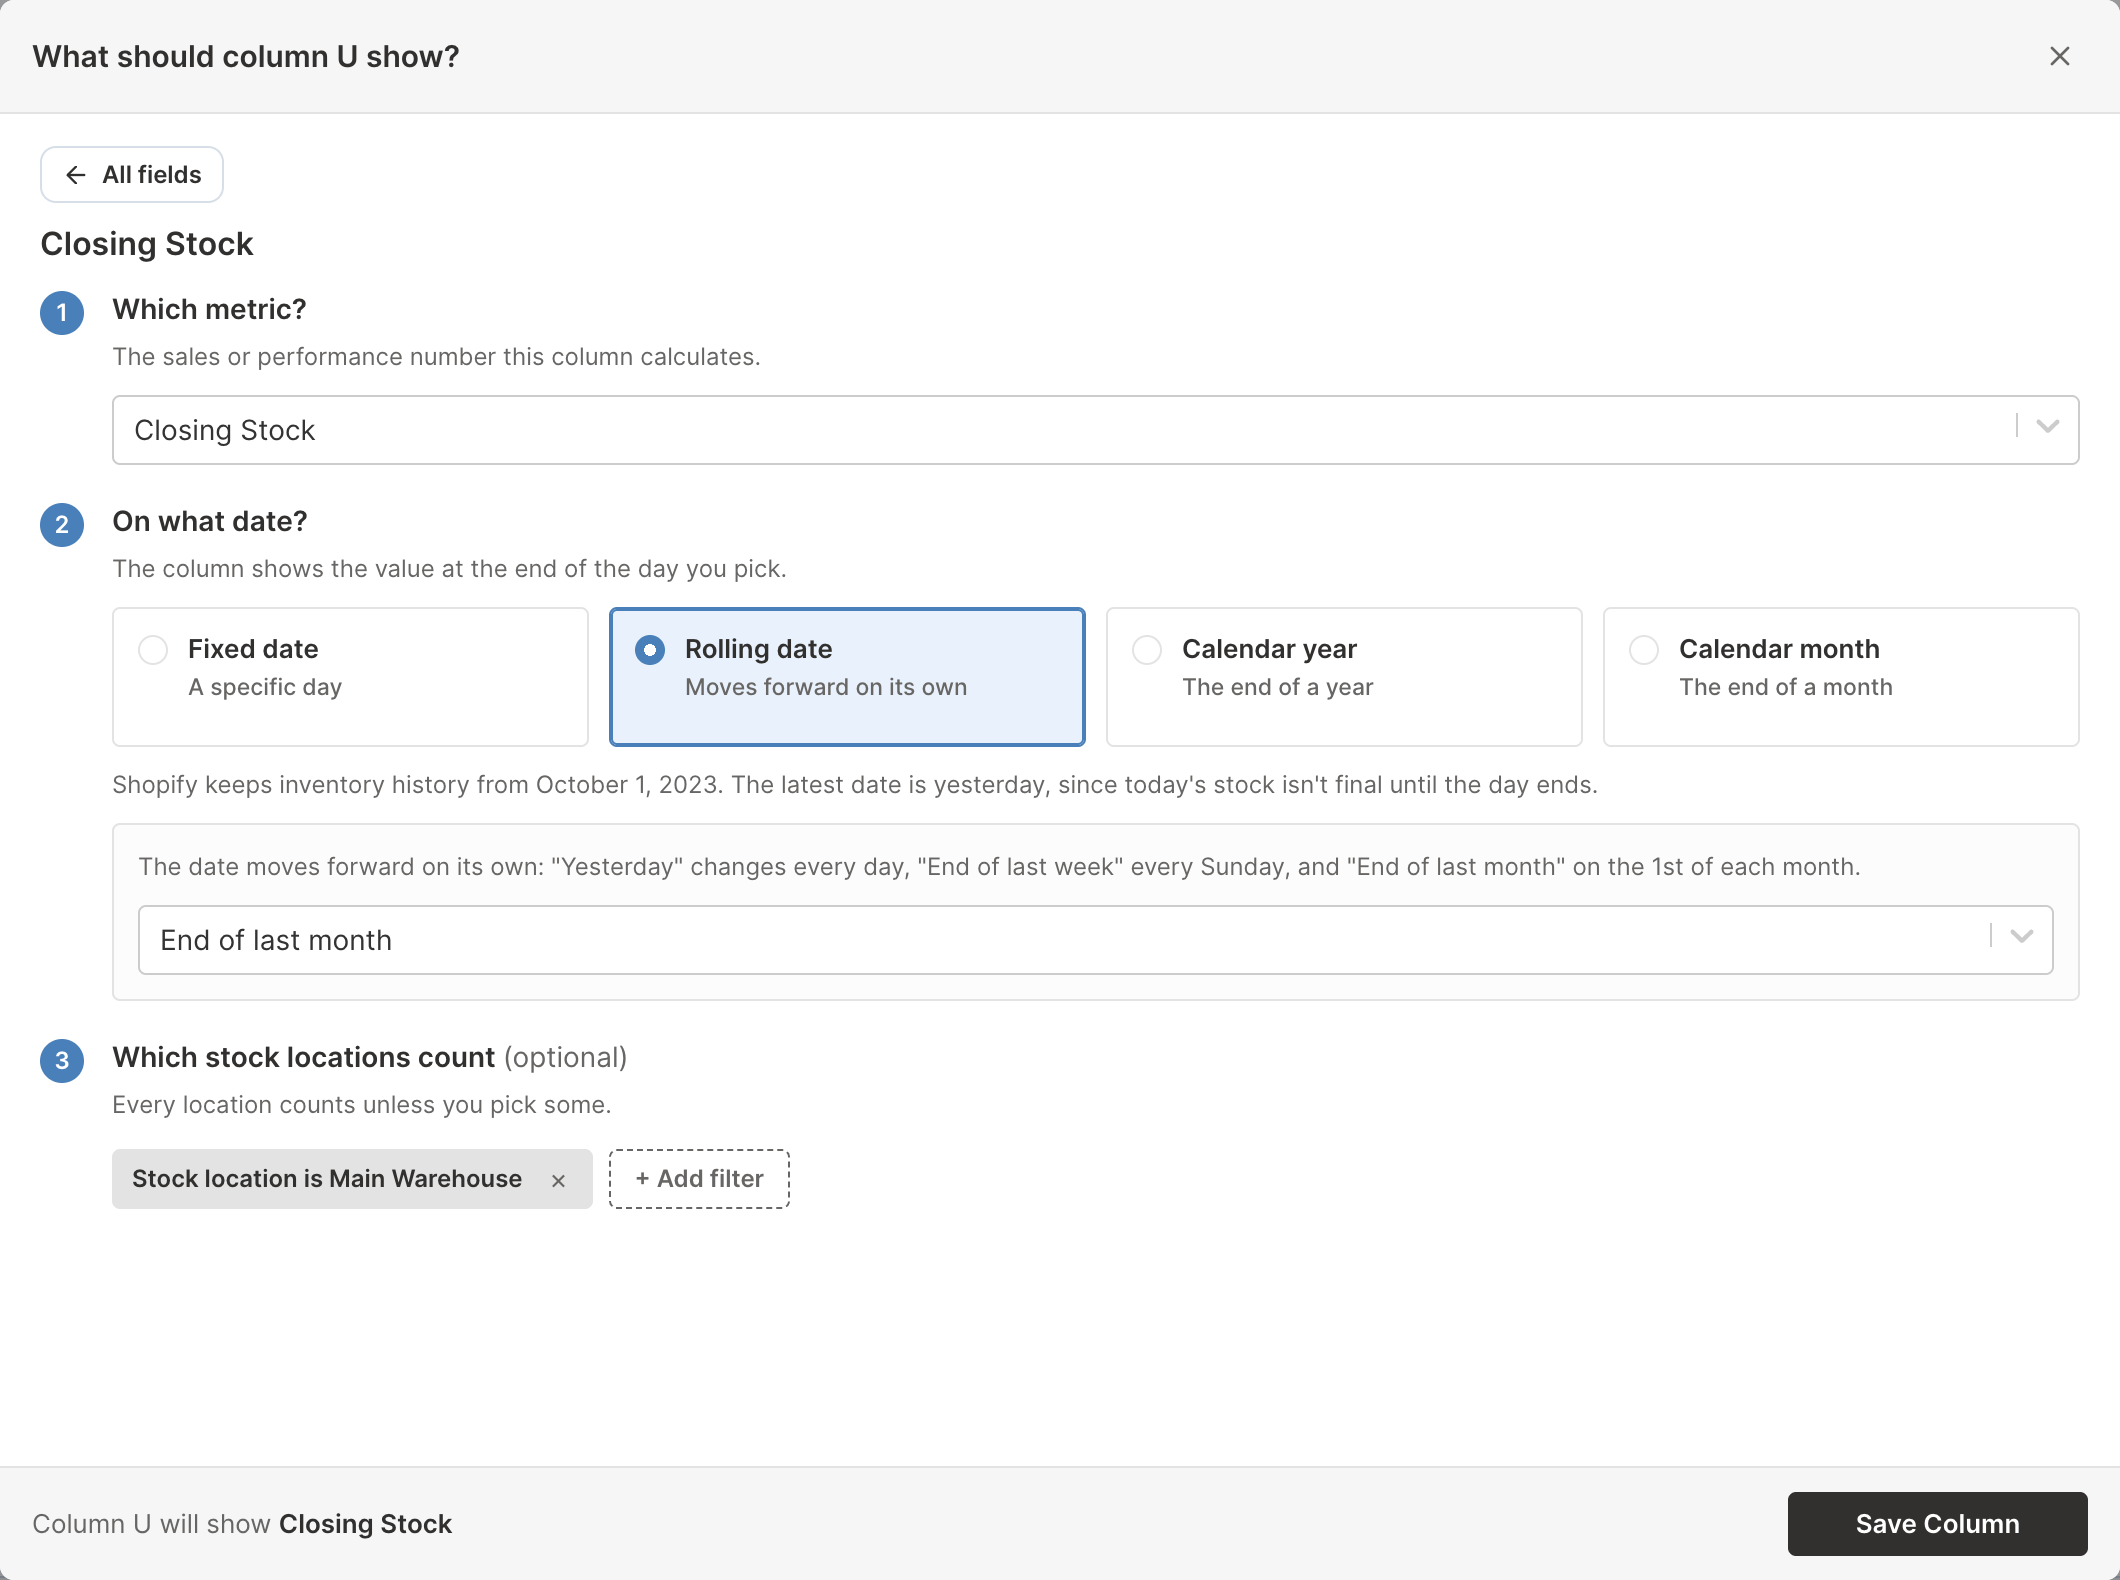
The column header names the metric, the dates, and any locations you picked, for example Closing Stock · Yesterday or Days Out of Stock · Last month · Stock location: Main warehouse. Each cell shows Calculating… until its number arrives.

Metrics that describe one day
Seven metrics describe a single day rather than a period: Opening Stock, Closing Stock, Closing Value at Cost, Closing Value at Retail, Units Without Cost, Out-of-Stock Variants, and Last In-Stock Date. Opening Stock shows the stock at the start of the day you pick, and the others show it at the end. Their date choices are:
- Fixed date: one specific day, picked in the calendar or with a shortcut such as Yesterday, End of last week, or End of last month
- Rolling date: Yesterday, End of last week, or End of last month, which move forward on their own
- Calendar year or Calendar month: the end of a year or month that has finished, such as End of 2025
For Opening Stock, these choices read Start of last week, Start of last month, and Start of 2026 instead, and the calendar choices include the year or month you’re in.
Metrics that cover a period
The other metrics cover a period. Their date choices are:
- Fixed dates: a start date and an end date, with shortcuts such as Past month, Past year, and Since October 1, 2023 (Since October 2, 2023 for Stock Change)
- Rolling period: Yesterday, Last Week (Sun - Sat), Last month, Last 30 days, Last 60 days, or Last 6 months, which move forward on their own
- Calendar year or Calendar month: one year or month that starts within your history, so the earliest year you can pick is 2024. The current one covers the days so far, through yesterday
For more on how these choices behave, see Shopify analytics timeframes.
Add inventory metrics to a Pivot Table worksheet
A Pivot Table worksheet gives each stock location, vendor, product type, product category, or product tag its own row, with one column per metric. It is the quickest way to compare stock across warehouses, stores, or suppliers.
- Click the + at the end of the worksheet tabs, or choose Worksheet > Add worksheet…
- Select Reporting worksheet, then click Continue
- Under Start from scratch, select Blank pivot table, then click Continue
- Under Break down by, choose Location for one row per stock location. Choose Vendor, Product type, Product category, or Product tag for one row per group of products
- Under Metrics, select the metrics you want from the Inventory group. Each one becomes a column
- Under Time period, choose Rolling period, Fixed dates, Calendar year, or Calendar month, then pick the dates. Do this after choosing the metrics, because adding or removing inventory metrics can clear the time period. All time isn’t offered while an inventory metric is selected
- Click Create Worksheet
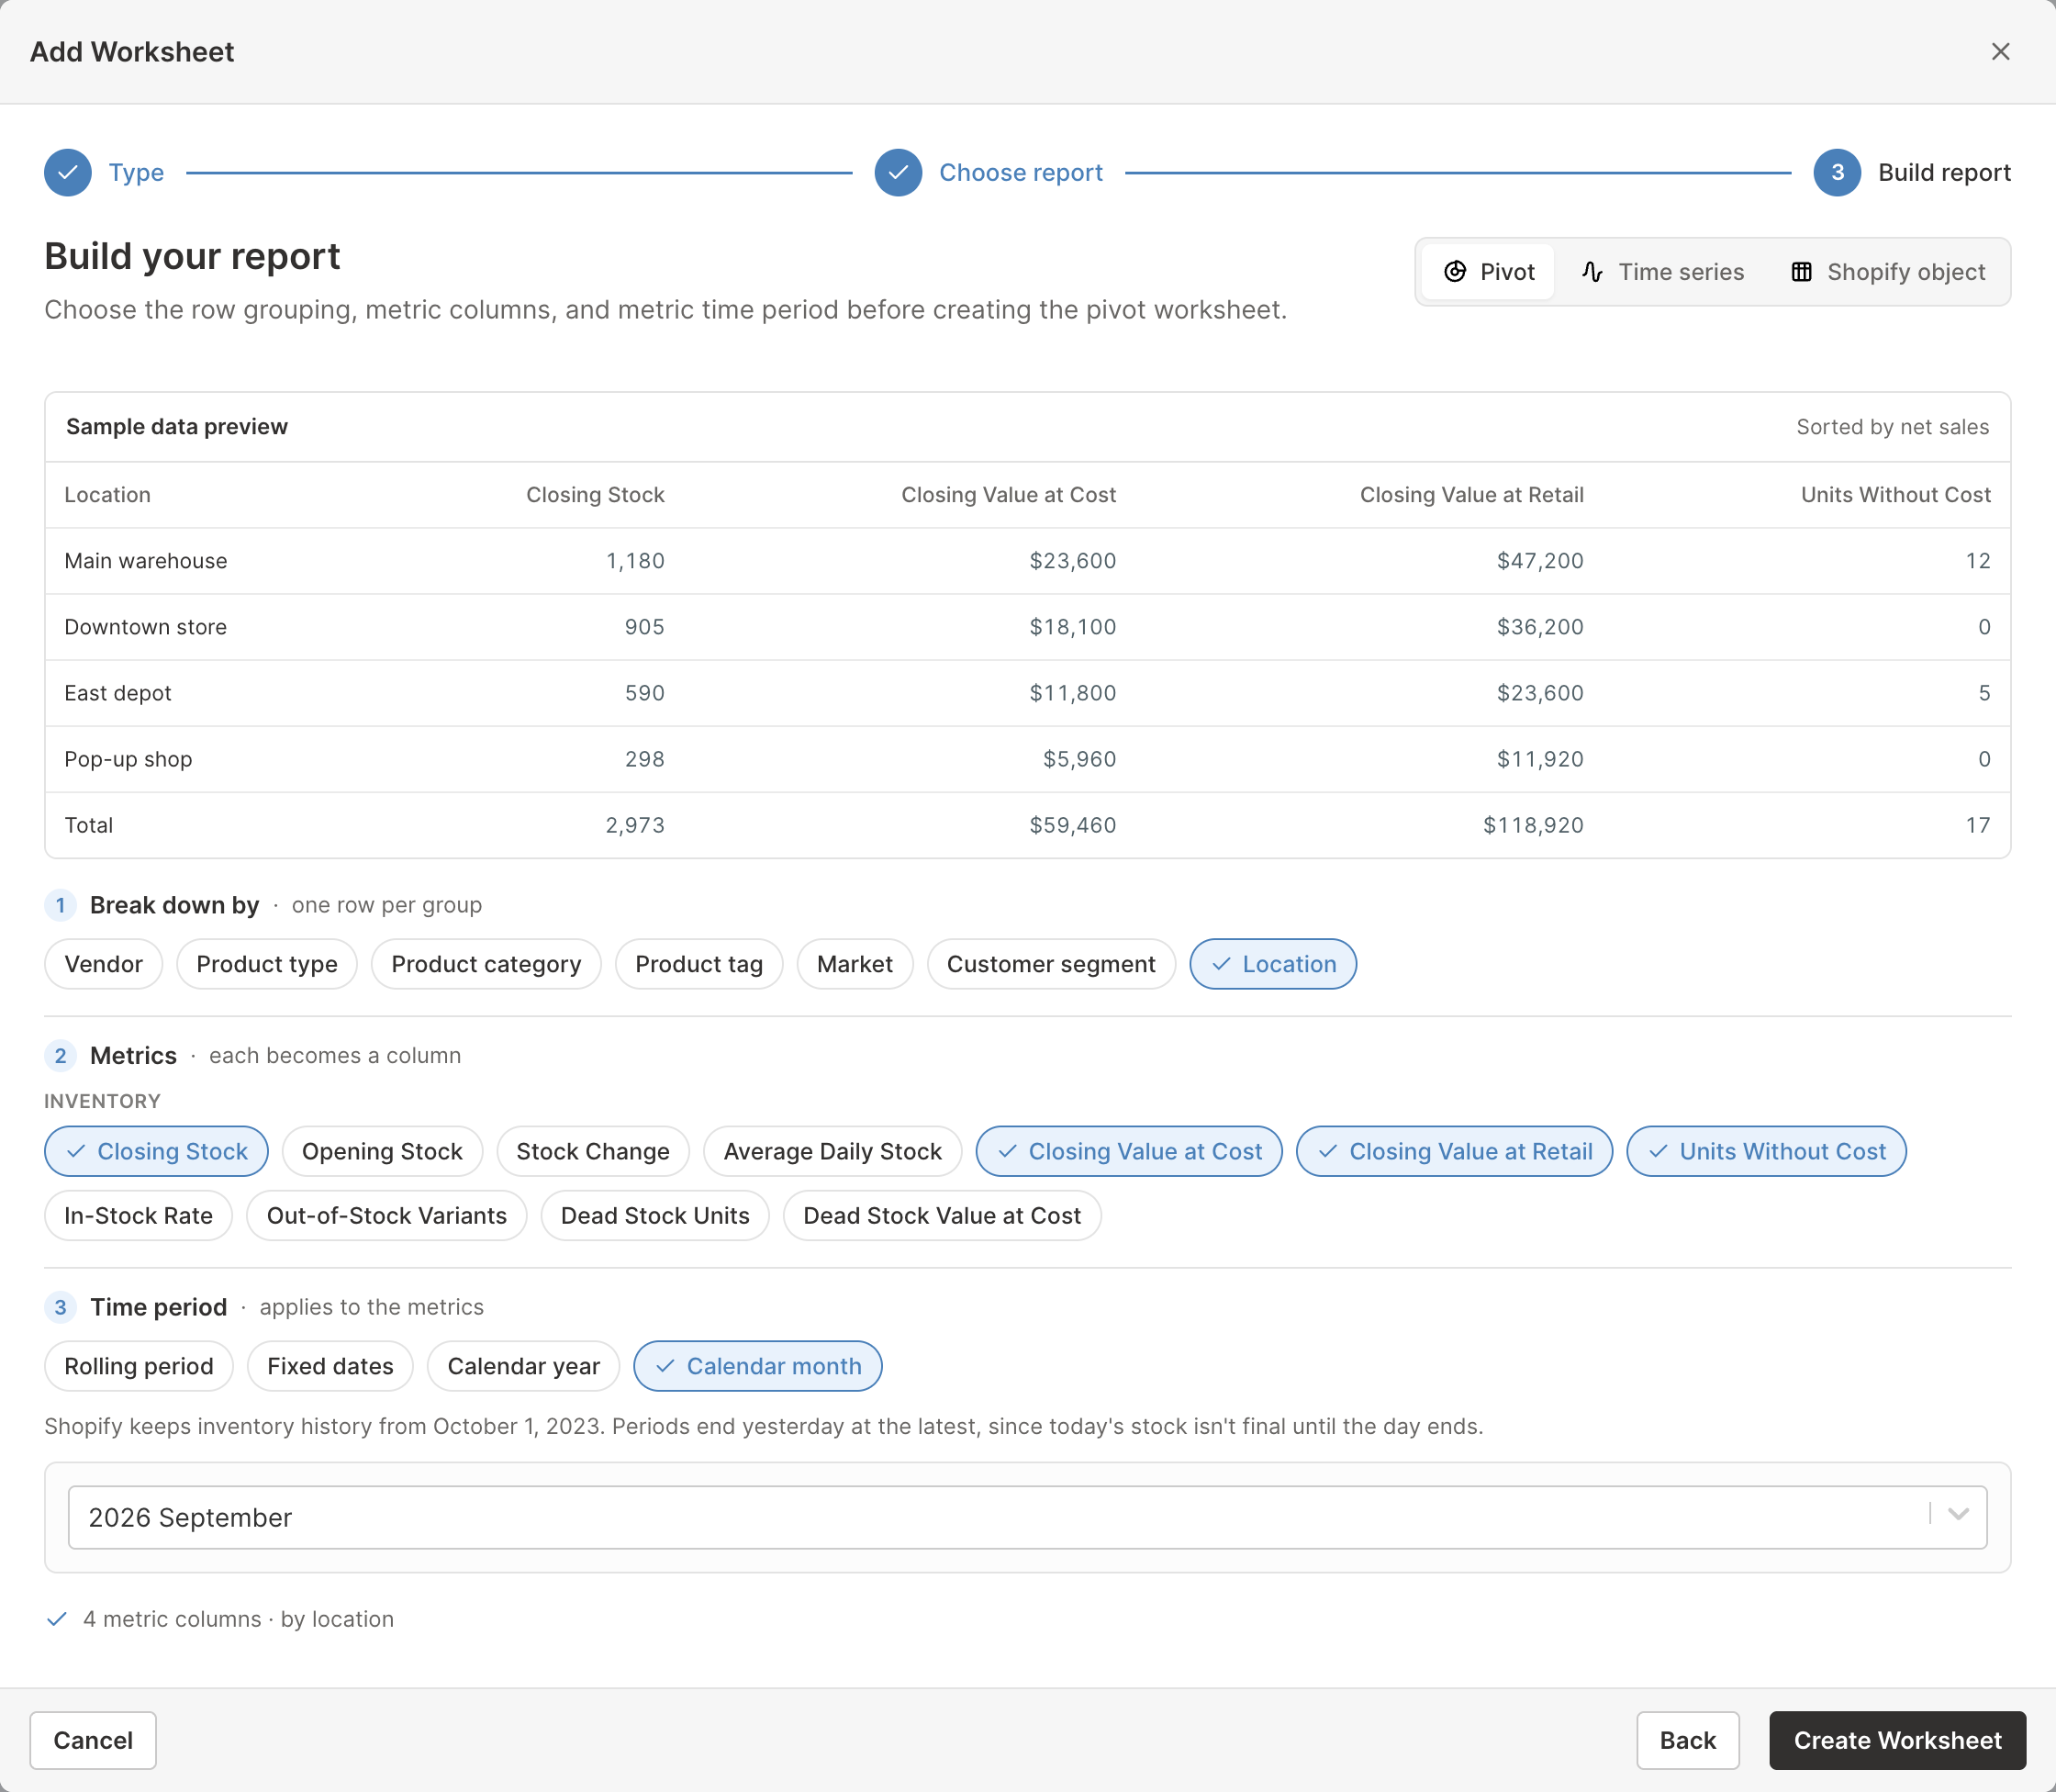
The time period applies to every column the builder creates. Metrics that describe one day read it at its edge: Closing Stock shows the stock at the end of the period’s last day, and Opening Stock at the start of its first day. To add another metric with its own dates or locations later, click + Analytics data in the header row of an empty column. The analytics settings open right away. Pick the metric under Which metric?, where inventory metrics sit at the end under an Inventory heading, then choose the dates and stock locations as in the steps for analytics columns above.
For more on Pivot Table worksheets, see create a Pivot Table worksheet for Shopify data.
Add inventory metrics to a Time Series worksheet
A Time Series worksheet lays a metric out over time, with one column per day, week, month, or year. It is how you see stock building up before a season or running down after it.
- Click the + at the end of the worksheet tabs, or choose Worksheet > Add worksheet…
- Select Reporting worksheet, then click Continue
- Under Start from scratch, select Blank time series, then click Continue
- Under Break down by, choose Store to make each metric a row of store totals, Vendor or Product type for one row per group, or Location for one row per stock location
- Under Metrics (for Store) or Measure (for the other choices), pick from the Inventory group. Store rows take several metrics, while the other choices track one
- Under Time periods, choose By day (up to 90 columns), By week (up to 52), By month (up to 36), or By year (up to 10), then choose how many under for the last
- Click Create Worksheet
Each column is its own period. Closing Stock is the stock at the end of each day, week, month, or year, and Opening Stock is the stock at its start. When you create the worksheet, day columns end yesterday and week columns, Sunday to Saturday, end with last week. The columns keep those dates afterward rather than moving forward. The current month or year shows the days so far, through yesterday, and on its first day it shows Calculating… until a full day has passed.
A column that starts before your history does, such as the 2023 year column, shows No inventory history for metrics that need every day of the period or the day before it, such as Average Daily Stock and Opening Stock. Metrics read at the end of the period, such as Closing Stock, still show a number.
For more on Time Series worksheets, see create a Time Series worksheet for Shopify data.
Which report rows can show inventory metrics
| Rows | Inventory metrics |
|---|---|
| Vendor, product type, product category, and product tag rows | The 14 report metrics, totaled over the products in the group |
| Store rows | The 14 report metrics, totaled over the whole store |
| Location rows | 11 metrics: all but Estimated Lost Sales, Sell-Through Rate, and Inventory Turnover. Location rows show inventory metrics only, so a sales metric such as Net Sales shows N/A there |
| Market, customer segment, and marketing channel rows | None. These rows filter orders rather than stock, so inventory metrics show N/A |
The builders only offer the inventory metrics a breakdown can show. N/A appears when you add a column later that the rows can’t show. If you add a row yourself, by right-clicking an empty row’s number and clicking Choose what to analyze…, inventory metrics work on Products and Store rows, and show N/A on the other row types.
How totals add up
- A product adds up its current variants, and a collection adds up the products it holds today
- Vendor, product type, product category, and product tag rows add up the products that belong to the group today
- The store’s totals for stock levels and inventory value include variants you have deleted since, so past totals don’t change when you delete something. The metrics that compare stock with sales, such as Sell-Through Rate and Dead Stock Units, count only the variants you have today
- In-Stock Rate, Out-of-Stock Variants, and Estimated Lost Sales count only products that are for sale (active or unlisted) when they add up a collection, a report row, or the store. A product or variant row always shows its own numbers, whatever its status
- A product can be in several collections or carry several tags, so those rows can count the same stock more than once and won’t add up to the store total
Date rules
- History starts on October 1, 2023, the earliest day Shopify keeps inventory history. If your store opened later, it starts in the month your store was created
- Opening Stock and Stock Change start on October 2, 2023, because they need the stock at the end of the day before
- Today is never included. Today’s stock isn’t final until the day ends, so every date and period ends yesterday at the latest
- There is no All time choice, and the rolling periods that run through today (Today, Current Week (Sun - Today), and Current month) aren’t offered. Last 30 days means the 30 days before today
- Fixed dates end yesterday at the latest, so a shortcut such as Past week stops at yesterday
- Mixtable downloads each finished day early the next morning, in your store’s time zone. Until it arrives, a column that ends yesterday keeps showing its previous numbers
The date settings repeat the main rule in a note. For a period, it reads: “Shopify keeps inventory history from October 1, 2023. Periods end yesterday at the latest, since today’s stock isn’t final until the day ends.” For a single date, the second sentence reads “The latest date is yesterday” instead.
The inventory history download
Mixtable Analytics Spreadsheet starts downloading your inventory history in the background after it first loads your store data. It works through the history a month at a time, which can take a while for a large catalog. The panel that shows your store data downloading lists it as, for example, Inventory history (14 of 36 months). Once it is the only download left, the panel in your spreadsheet reads Loading your inventory history (14 of 36 months) and “Inventory reports fill in when it’s done.”
When the download finishes, every inventory cell fills in on its own, and from then on Mixtable adds each new day early every morning.
You can also check on it from the spreadsheet. On a worksheet with inventory metrics, the sync control at the top right of the spreadsheet shows Download latest until the history is complete. Click it to open the sync card. Under Download latest from Shopify, the Inventory history row tells you where things stand:
| What the row says | What to do |
|---|---|
| Not downloaded yet. | Click Download to start the download |
| Loading (14 of 36 months) | Nothing. It is on its way |
| Stopped before it finished. | Click Try again. It picks up where it stopped |
| Needs permission to read your Shopify reports. Approve the updated app permissions in Shopify to turn it on. | Approve the permission, as described below. The download restarts on its own |
Once the history is complete, the row goes away. The nightly updates keep the history current, so there is nothing more to download. For more on the sync control, see sync Shopify data with Mixtable.
What the cells can say
Every inventory cell shows a number or one of these messages:
| Cell | What it means |
|---|---|
| Calculating… | Mixtable hasn’t calculated the cell yet, for example right after you add a column |
| Waiting for inventory history | Your store’s inventory history hasn’t finished its first download. The numbers fill in on their own when it does. If the download stopped or needs permission, see the sync card, as described above |
| No inventory history | There is nothing to count: the variant doesn’t track inventory, was never stocked at the locations you chose, or the dates fall before your history starts |
| In stock | Last In-Stock Date: the variant, or one of the product’s variants, had stock at the end of the chosen day |
| Before 2023-10-01 | Last In-Stock Date: no stock at any point in the downloaded history. The date is the first day of your store’s history |
| No sales | Days of Stock Left: there is stock, but nothing sold during the period, so there is no sales pace |
| No stock | Inventory Turnover: the average daily stock was zero or below |
| No sales or stock | Sell-Through Rate: nothing sold and no stock was left |
| N/A | A report row that can’t show the metric, such as an inventory metric on a Market row |
What the metrics need to be accurate
- Mixtable Analytics Spreadsheet installed on your Shopify store. It’s free for stores with fewer than 1,000 lifetime orders; larger stores need a paid plan or its 7-day free trial
- Inventory tracking turned on for the variants you want to measure. Mixtable only downloads history for tracked variants, so untracked ones show No inventory history. See enable Shopify inventory tracking
- Cost per item filled in for Closing Value at Cost and Dead Stock Value at Cost. Units without a cost are left out of those values, and Units Without Cost shows how many there are. See cost per item in Shopify
- Permission to read your Shopify reports. Shopify makes inventory history available through its reports, so Mixtable Analytics Spreadsheet asks for this permission. If you installed the app before inventory analytics arrived, open Mixtable Analytics Spreadsheet in your Shopify admin and approve the updated app permissions. The download then starts on its own
Inventory metrics are not a live stock count
Inventory metrics describe days that have finished. Closing Stock for yesterday won’t match the stock in your Shopify admin right now, and it won’t change until the next day is downloaded. To see current quantities by location, and to edit them with Mixtable Spreadsheet Editor, add a Stock at column for a location (in the Inventory section of the field picker) to a Products (with variants) worksheet, as described in Shopify inventory management and tracking. Put both side by side to compare today’s stock with where it stood a month ago.