


Related data fields in your Shopify spreadsheet
Related data fields in your Shopify spreadsheet
Mixtable’s Related Data Fields pull details out of related Shopify records and show them right in the worksheet you are already using. An Orders worksheet can show the vendors you shipped and the tracking number for each parcel, a Products worksheet can total up your inventory value, and a Media Images worksheet can show which products use each image. No formulas, no VLOOKUPs, and no jumping between worksheets.
Each one becomes an ordinary spreadsheet column. Mixtable fills it in for you, refreshes it as your Shopify data changes, and includes it when you sort, filter, or export.
Where you can use related data fields
| Worksheet | What you can pull in |
|---|---|
| Orders (no line items) | Product, variant, fulfillment, and discount details for everything in the order |
| Orders (with line items) | Product and variant details for the item on each line |
| Products (no variants) | Inventory quantity and inventory value across a product’s variants |
| Customers | The dates of the customer’s first and last order |
| Media Images | The products and variants that use each image |
Adding one works the same way everywhere:
- Select an empty column, meaning a column without a green header
- Click the
 button in the column header
 - Choose Related Data Fields
- Click the field you want
- Choose how the values should be combined, when the field gives you a choice
- Click Save Column
Mixtable then fills the column in for the rows already in the worksheet. The rest of this guide covers what each worksheet can pull in.
How Mixtable combines related values
One order can hold many products, and one product can have many variants, so a related data field often has more than one value to fit into a single cell. That is what step 5 above is asking about.
| Option | What the cell shows |
|---|---|
| Comma Separated | Every related value joined with commas, repeats included |
| Unique Comma Separated | The same list with duplicates removed |
| Count | How many related records there are |
| Sum | All the values added together |
| Average | The average of the values |
| Minimum | The smallest value, which for dates means the earliest |
| Maximum | The largest value, which for dates means the latest |
Mixtable only offers the options that make sense for the field you picked, and some fields skip the question entirely. A cell stays blank when there is nothing to show. Count is the exception, since it shows 0.
Your choice is recorded in the column header, so a SKU column grouped as a unique list reads Variant SKUs (Unique Comma Separated). To change your mind later, add the field again in a new column with a different option.
Related data fields for Orders
An Orders (no line items) worksheet gives every order a single row, which keeps the list readable but hides what was actually in each order. Related Data Fields put that detail back on the order row, so you can filter orders by vendor, spot split shipments, or check which discount was used.
Product and variant details
| Field | What the column shows |
|---|---|
| Product Vendors | The vendors of the products in the order |
| Product Category Names | The Shopify product categories of those products |
| Product Types | The product types of those products |
| Product SEO Titles | The SEO titles of those products |
| Product SEO Descriptions | The SEO descriptions of those products |
| Variant SKUs | The SKUs of the exact variants sold |
| Variant Barcodes | The barcodes of those variants |
| Product Metafields | The value of one product metafield that you choose |
| Variant Metafields | The value of one variant metafield that you choose |
The two metafield fields ask you which metafield you want before you save, so add one column per metafield you want to see. Because metafields often hold numbers, these fields also accept Sum, Average, Minimum, and Maximum.
Fulfillment and delivery
| Field | What the column shows |
|---|---|
| Fulfillment Count | How many fulfillments the order has, which is how you spot split shipments |
| First Fulfillment Date | When the order was first fulfilled |
| In-Transit Date | When the shipment entered transit |
| Estimated Delivery | The estimated delivery date carried by the fulfillment |
| Delivery Date | When delivery was completed |
| Fulfillment Service | The service that handled the fulfillment |
| Fulfillment Locations | The locations the order shipped from |
| Origin Location | The full shipping origin address, falling back to the location name when Shopify has no address |
| Fulfillment Tracking Carriers | The carriers handling the shipment |
| Fulfillment Tracking Numbers | The tracking numbers for the shipment |
New Orders (no line items) worksheets already include the fulfillment summaries most merchants want: Fulfillment Count, First Fulfillment Date, In-Transit Date, Estimated Delivery, Delivery Date, Fulfillment Service, and Fulfillment Tracking Carriers. Add the rest whenever you need them.
Tip: An unfulfilled order shows
0in Fulfillment Count and blanks in the date columns, so filtering on those two columns is a quick way to find orders that still need attention.
Discounts
| Field | What the column shows |
|---|---|
| Discount Type | The kind of Shopify discount that was applied |
| Value Type | Whether the discount takes off a fixed amount or a percentage |
| Value Amount | The fixed amount the discount takes off |
| Value Percentage | The percentage the discount takes off |
How to add related data to your Shopify Orders (no line items) worksheet
To use Related Data Fields for Orders, you’ll need a Mixtable spreadsheet that contains a worksheet with your Shopify Order data. If you haven’t created one yet, start by installing the Mixtable Spreadsheet Editor app from the Shopify App Store. Once that’s done, you can quickly create a spreadsheet and start pulling in related data with just a few clicks.
Note: You can either add an Orders (no line items) worksheet to an existing spreadsheet, or create a new one using our Orders and Order Items template to get started quickly.
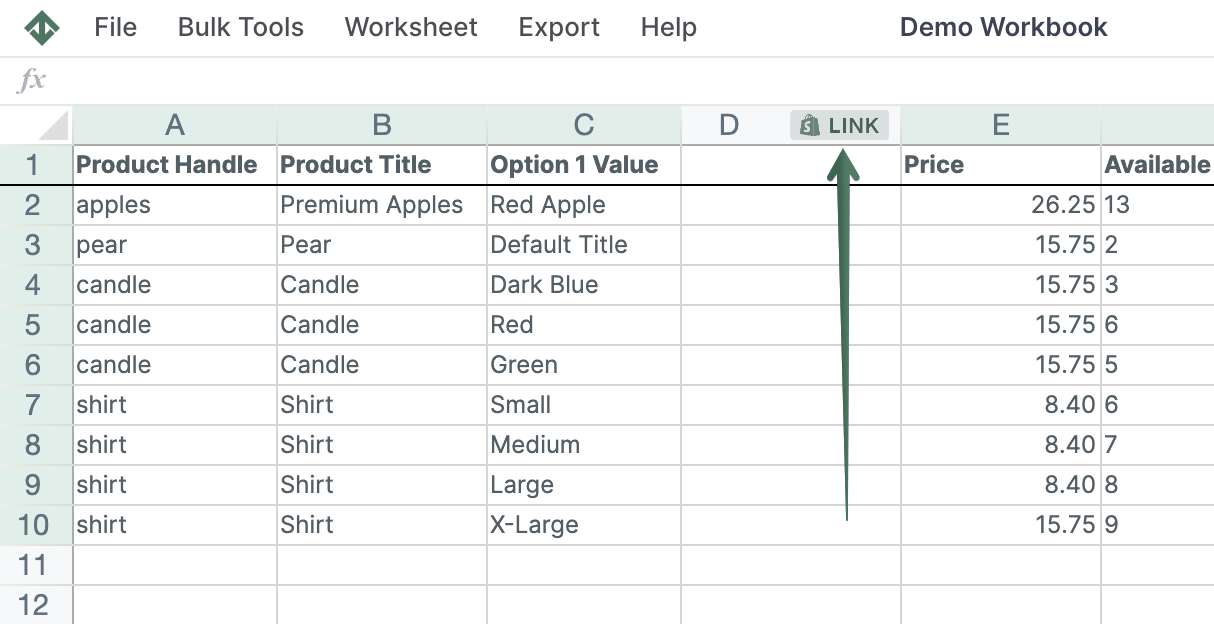
To load new Shopify data, start by selecting an empty column, meaning any column with a non-green header. A green header means the column is already linked to Shopify data. Then click the button in the column header to open the selection window and choose the data you want to pull in.
From the Shopify Sync Settings window, choose Related Data Fields.
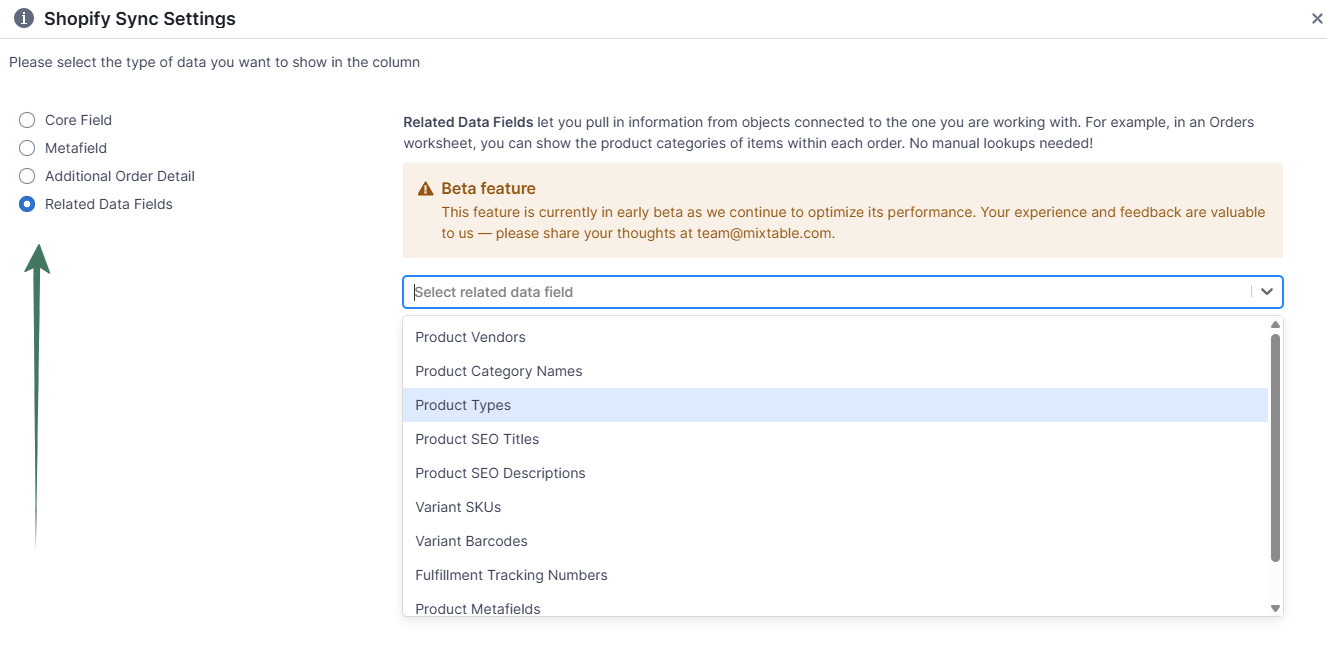
Then click the field you want, choose how its values should be combined, and click Save Column. Text fields such as vendors and SKUs usually read best as a unique list, dates work well with the earliest or latest value, and Fulfillment Count uses a count.
Related data fields for order line items
An Orders (with line items) worksheet gives every item in an order its own row. Each row already knows its product and variant, so these fields fill in the details Shopify keeps on the product record rather than on the order:
- Product Vendor
- Product Category Name
- Product Type
- Product SEO Title
- Product SEO Description
- Variant SKU
- Variant Barcode
- Product Metafield, for one product metafield that you choose
- Variant Metafield, for one variant metafield that you choose
Add them the same way you would on an Orders worksheet: select an empty column, click the button, choose Related Data Fields, pick a field, and click Save Column. There is no grouping step here, because a line item points at a single product and variant.
Tip: This is the quickest way to group order history by vendor, product type, or category. Add the field as a column, then sort or filter the worksheet by it.
Related data fields for Products
With Related Data Fields, you can pull related inventory information directly into your Products worksheet. No more VLOOKUPs or linking across sheets.
To use Related Data Fields for Products, make sure you have a Mixtable spreadsheet with a worksheet that contains your Shopify Product data. If you haven’t set one up yet, install the Mixtable Spreadsheet Editor app from the Shopify App Store. Once installed, you can easily create a spreadsheet and start linking related product data into your spreadsheet.
Note: The worksheet needs to show product information. You can create one using our Basic Product Info template, or add a Products (no variants) worksheet to an existing spreadsheet.
To load new Shopify data, start by selecting an empty column, meaning any column with a non-green header. A green header means the column is already linked to Shopify data. Then click the button in the column header to open the selection window and choose the data you want to pull in.
From the Shopify Sync Settings window, choose Related Data Fields.
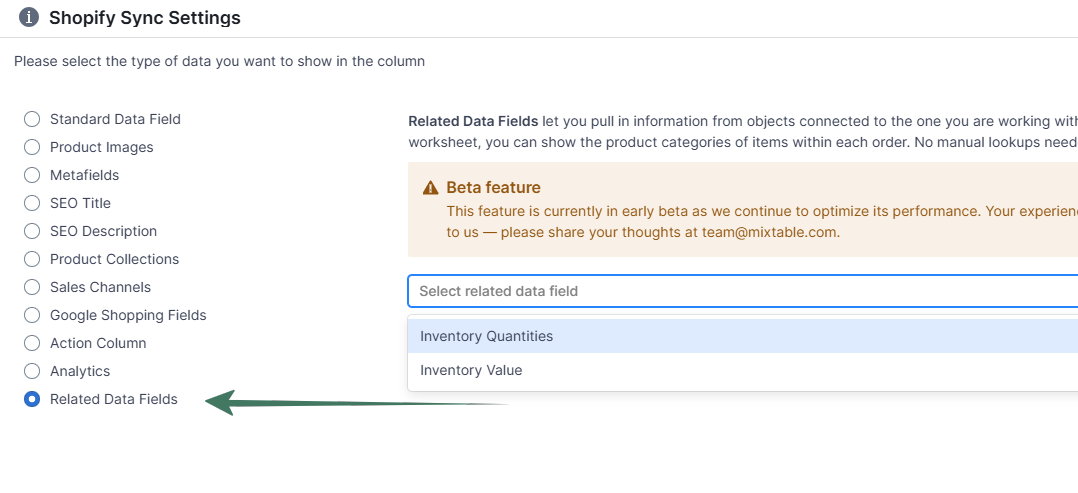
Two fields are available:
Inventory Quantities shows the stock levels across all variants of a product. Display it as a comma-separated list (for example, 6, 11), a total sum, an average, or the minimum or maximum quantity. The sum is the fastest way to see how many units of a product you hold in total, and the minimum is a good early warning that one variant is about to sell out.
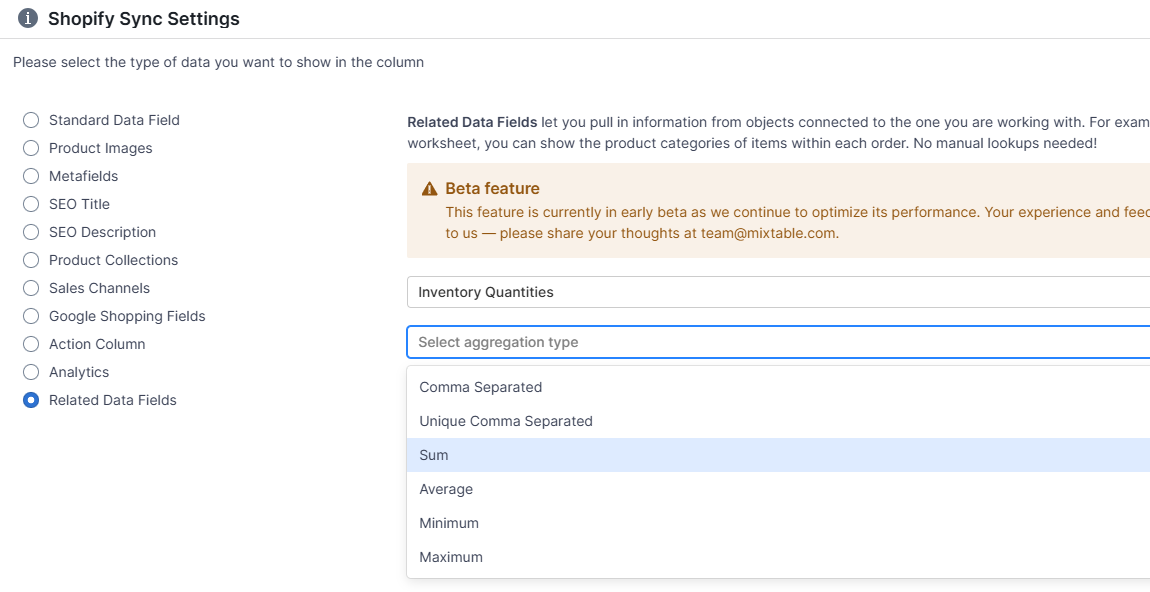
Inventory Value works out what a product’s stock is worth by multiplying each variant’s inventory quantity by its cost per item. Choose Sum for the product’s total value, or Average, Minimum, or Maximum to summarize the variants another way. Variants with no cost recorded in Shopify are left out of the calculation, so fill in cost per item first if a total looks lower than you expect.
Related data fields for Customers
A Customers worksheet can show when each customer bought from you, without opening a single order:
- First Order Date, the date of the customer’s earliest order
- Last Order Date, the date of their most recent order
Select an empty column, click the button, choose Related Data Fields, pick the field, and click Save Column. There is no grouping step, since each field returns one date.
Tip: Put both columns side by side to see a customer’s whole lifespan at a glance. Sorting by Last Order Date brings the customers who have gone quiet to the top of the worksheet.
Related data fields for Media Images
A Media Images worksheet lists the images in your Shopify store, one image per row. That is great for editing ALT text or tidying up your media, but the row itself does not tell you where the image is actually used.
Related Data Fields answer that question. They add columns showing the products and variants each image belongs to, so you can tell near-identical images apart and see what an image is attached to before you change or delete it.
| Field you can add | What the column shows |
|---|---|
| Product Titles | Titles of the products using the image |
| Product Handles | URL handles of those products |
| Product Shopify IDs | Shopify IDs of those products |
| Variant Shopify IDs | Shopify IDs of the variants using the image |
| Variant SKUs | SKUs of those variants |
| Variant Barcodes | Barcodes of those variants |
Add product or variant details to a Media Images worksheet
Start in a Media Images worksheet. If your spreadsheet does not have one yet, click the (+) button beside your worksheet tabs to add it.
To load new Shopify data, start by selecting an empty column, meaning any column with a non-green header. A green header means the column is already linked to Shopify data. Then click the button in the column header to open the selection window and choose the data you want to pull in.
In the Shopify Sync Settings window that opens:
- Choose Related Data Fields
- Click the field you want to show, for example Variant SKUs
- Choose Comma Separated, the only grouping option for these fields
- Click Save Column
Mixtable fills in the column for the images already in the worksheet. Larger stores take a little longer to finish.
What you will see in the column
An image can belong to more than one product or variant, so Mixtable lists every related value in a single cell, separated by commas, for example Blue Hoodie, Blue Hoodie Sample. Repeated values are kept rather than merged, so two variants that share one SKU show that SKU twice.
If the columns come up blank
A blank cell usually means one of two things:
- The image is not attached to any product or variant, which is normal for files you uploaded to Shopify but never used on a product
- Mixtable has not mapped the links between your images, products, and variants yet, which happens on stores that were connected before these fields existed
For the second case, re-download all Shopify product data. That rebuilds the links between your Shopify images, products, and variants, and the columns fill in as the download progresses.
Good to know about related data columns
- Related data columns are for reference, so you cannot type into them and sync the change back to Shopify. Edit the underlying product, variant, or order field instead, and the related column catches up on its own
- Values come from Shopify, so a blank cell nearly always means Shopify has nothing to show for that record yet
- You can add the same field more than once with different grouping options, for example inventory quantity as both a sum and a minimum
- These columns behave like any other column when you sort, filter, use them in formulas, or export your Shopify data to Excel or CSV
You are ready!
Well done! Now that you have related order or product data in an online spreadsheet, you can use any Excel function to analyze the data, such as:
- Sort ascending or descending,
- Find-replace,
- Filter,
- Use Excel formulas, e.g., for price changes, etc.
Find out more about the Mixtable suite of products here.
Manage Shopify data in a spreadsheet.
Use Mixtable to edit, sync, analyze, import, and export your Shopify store data without CSV juggling.