


Shopify Sales by Vendor, Product Type, Category, and Tag
Shopify Sales by Vendor, Product Type, Category, and Tag
Product attributes turn a catalog into useful Shopify analytics groups. Mixtable can compare sales by vendor, product type, standardized product category, product tag, and collection without requiring you to export line items and group them manually.
Why group products instead of ranking them
A product-by-product ranking is useful right up until you have a few hundred products. After that it tells you which individual items sell and almost nothing about your business, because the pattern lives one level up.
Grouping by vendor, product type, category, or tag is where the useful questions get answered:
- Which suppliers are worth better terms, and which are not worth reordering from
- Whether a whole category is growing or one product inside it is carrying everything
- How the products you tag as new, sale, or seasonal perform as a group
- Where discounting is concentrated, which is usually a category habit rather than a product decision
- Which parts of the catalog deserve more range and which are overstocked
The same product appears in each of these groupings, so you are not looking at different data. You are looking at the same sales through a supplier lens, a merchandising lens, or a campaign lens, and each one supports a different decision.
Each breakdown answers a different merchandising question, and the totals do not all behave the same way.
Choose the right Shopify product breakdown
| Breakdown | What it uses | Best for |
|---|---|---|
| Vendor | The product vendor in Shopify | Supplier and brand performance |
| Product type | Your store’s custom product-type value | Internal assortment groupings |
| Product category | Shopify’s standardized taxonomy | Consistent category reporting |
| Product tag | Any product tag assigned in Shopify | Campaign, feature, season, or merchandising labels |
| Collection | Shopify collection membership | Storefront merchandising groups |
Each of these fills the whole report in one step, giving you a row for every vendor, type, category, tag, or collection in your store.
Group products your own way
The five breakdowns above cover the groups Shopify already knows about. When the group you care about does not match a single Shopify field, build the row yourself instead.
In any Pivot Table worksheet, click the  button in an empty row header, choose the Shopify object to analyze, then select Only matching and write the conditions. The row includes every record meeting all of them, and it sits beside your generated rows in the same report.
This is what lets a report answer a question no single attribute describes:
- Combine two attributes. One row for a vendor’s products that also carry your
saletag, beside a row for the same vendor’s untagged products - Split by cost. One row for variants with a cost above a threshold and another for those below, to compare how your price tiers really perform
- Compare new against established. One row for products created this year, another for everything older
- Isolate a data gap. One row for products with no product category assigned, or variants with no cost recorded, to see how much revenue is sitting in records you cannot report on properly
- Segment customers yourself. Rows for customers above a lifetime spend threshold, above an order count, or in a particular country
Conditions use the fields Mixtable stores for analytics. For products that is vendor, product type, product category, product tag, and created or updated dates. For variants it is SKU, cost, and dates. For collections it is the collection and its published or updated dates. For customers it is total spent, order count, and default address country or city.
Give each custom row a clear label, since the label is what tells anyone reading the report which group they are looking at. For the full walkthrough, see add a custom reporting row.
Compare sales by vendor
Use vendor analytics for supplier, brand, and purchasing decisions. The ready-made Vendor sales leaderboard compares Net Quantity Sold, Gross Sales, discounts, refunds, and Net Sales.
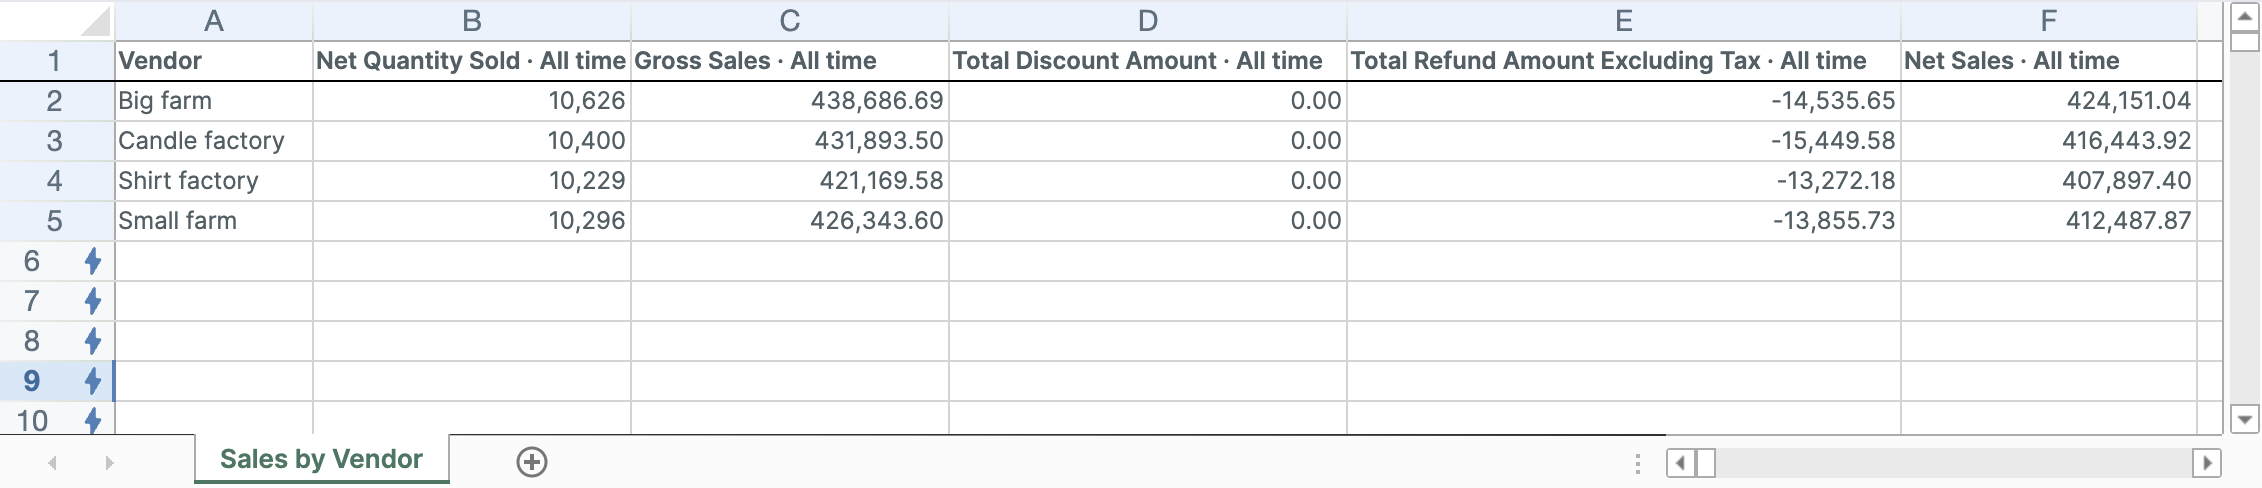
For trends, use Vendor net sales by year or change a Time Series worksheet to monthly columns.
Useful questions include:
- Which vendors carry the most Net Sales?
- Which rely heavily on discounts?
- Which produce high refund value?
- Which are growing or declining over time?
See the Sales by Vendor template for a complete new spreadsheet.
Compare sales by product type
Product type is a custom Shopify field controlled by the store. It is useful when your internal merchandising structure does not match Shopify’s standardized category taxonomy.
Mixtable supports product type in Pivot Table worksheets and Time Series worksheets. Use Product type net sales by month to compare seasonality and recent momentum.
Product-type reporting is only as consistent as the values in Shopify. T-Shirt, T-Shirts, and Tees become separate groups. Clean the underlying product types before using the report for an important comparison.
See the Sales by Product Type template.
Compare sales by Shopify product category
Product category uses Shopify’s standardized taxonomy. Products without a category are grouped into a clear Uncategorized row.
The ready-made Category sales breakdown includes Net Sales, Gross Sales, Net Quantity Sold, discounts, and refunds.
Use category reporting for:
- Comparing major merchandise families
- Finding categories with high refunds or discount dependence
- Checking whether uncategorized products represent meaningful sales
- Planning category-level assortment or content work
See the Sales by Product Category template.
Compare sales by product tag
Tags are flexible and can represent season, material, audience, campaign, supplier status, margin tier, or any other system your team maintains.
The ready-made Product tag scorecard includes Net Sales, Gross Sales, Net Quantity Sold, Orders Count, and refunds.
One product can have several tags, so the same Shopify order activity can contribute to several tag rows. Do not add every tag row together and treat the result as store sales.
Tag analytics is best for comparing tag-defined groups, not reconciling a mutually exclusive total.
See the Sales by Product Tag template.
Compare sales by collection
Collections represent Shopify storefront merchandising groups. Like tags, collections can overlap because one product can belong to several collections.
Use collection analytics to compare curated groups, navigation structures, seasonal collections, or campaigns. See Shopify Collection Analytics.
Create a product-attribute Pivot Table worksheet
- Click the + button beside the worksheet tabs
- Select Reporting worksheet, then click Continue
- Choose a ready-made Pivot Table report or Blank pivot table
- Click Continue
- Under Break down by, choose Vendor, Product type, Product category, Product tag, or Collection
- Select the metrics
- Choose the timeframe
- Click Create Worksheet
Build a better scorecard
Use a combination rather than ranking by one number:
- Gross Sales for original demand
- Total Discount Amount for promotion dependence
- Total Refund Amount Excluding Tax for money returned
- Net Sales for retained merchandise revenue
- Net Quantity Sold for unit movement
- Orders Count for order frequency
- Average Order Value where supported for basket size
Add formula columns for discount share, refund share, or growth. Then sort by the metric tied to the decision.
Keep Shopify product data clean
These reports inherit their row labels from Shopify. Improve report quality by:
- Standardizing vendor spelling
- Consolidating duplicate product types
- Assigning standardized product categories
- Removing obsolete or redundant tags
- Using clear collection names
Mixtable analytics can reveal inconsistent groups, but the correct fix is usually to clean the source product fields and intentionally sync those changes to Shopify.
Manage Shopify data in a spreadsheet.
Use Mixtable to edit, sync, analyze, import, and export your Shopify store data without CSV juggling.