


Create a Pivot Table Worksheet for Shopify Data
Create a Pivot Table Worksheet for Shopify Data
A Pivot Table worksheet summarizes Shopify performance with one row per business group and one column per metric. It is the fastest Mixtable report for questions such as which vendor drives the most Net Sales, which product categories absorb the most discounts, or which customer segments place the highest-value orders.
Unlike a Shopify data worksheet, a Pivot Table worksheet does not need one row for every record. It groups the records for you and calculates the selected metrics for each group.
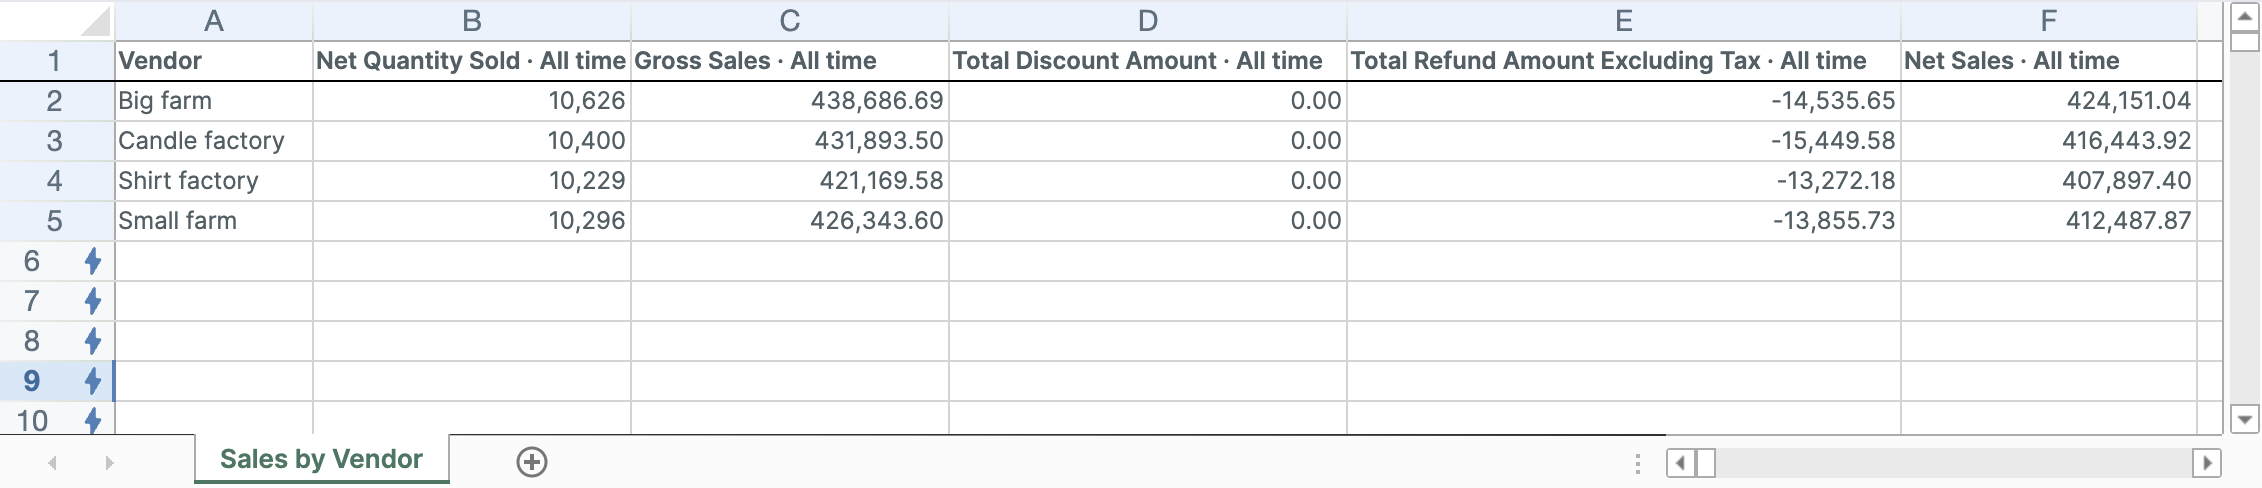
The result is an ordinary worksheet. Each column header records the metric and the timeframe it covers, and the blue  buttons in the empty rows below are where you add more rows of your own.
What you can break the report down by
Choosing a breakdown generates every row for you in one step, which is why most reports start there. It is not the only way to get rows, though: you can also define rows yourself with your own conditions, covered under add a custom reporting row below.
The Pivot Table builder supports these breakdowns:
- Vendor: one row per Shopify product vendor
- Product type: one row per custom product type in Shopify
- Product category: one row per standardized Shopify product category, plus Uncategorized
- Product tag: one row per product tag
- Market: one row per Shopify Market where orders were placed
- Customer segment: one row per segment defined in Shopify
Choose the dimension that matches the decision you are making. Vendor reporting helps with supplier decisions, while product category and tag reporting are usually better for assortment and merchandising decisions. If none of them groups your data the way you need, build the rows yourself instead.
Start with a ready-made Pivot Table report
Mixtable includes five ready-made Pivot Table reports:
- Vendor sales leaderboard
- Market sales mix
- Category sales breakdown
- Product tag scorecard
- Customer segment contribution
Each report opens the builder with a suggested breakdown, metrics, and timeframe. You can change those settings before creating the worksheet.
Create a Pivot Table worksheet
- Click the + button beside the worksheet tabs
- Select Reporting worksheet, then click Continue
- Under Pivot table, select a ready-made report, or choose Blank pivot table under Start from scratch
- Click Continue
- Under Break down by, select the group that should become the rows
- Under Metrics, select one or more calculated values for the columns
- Under Time period, choose the dates the metrics should cover
- Review the sample preview
- Click Create Worksheet
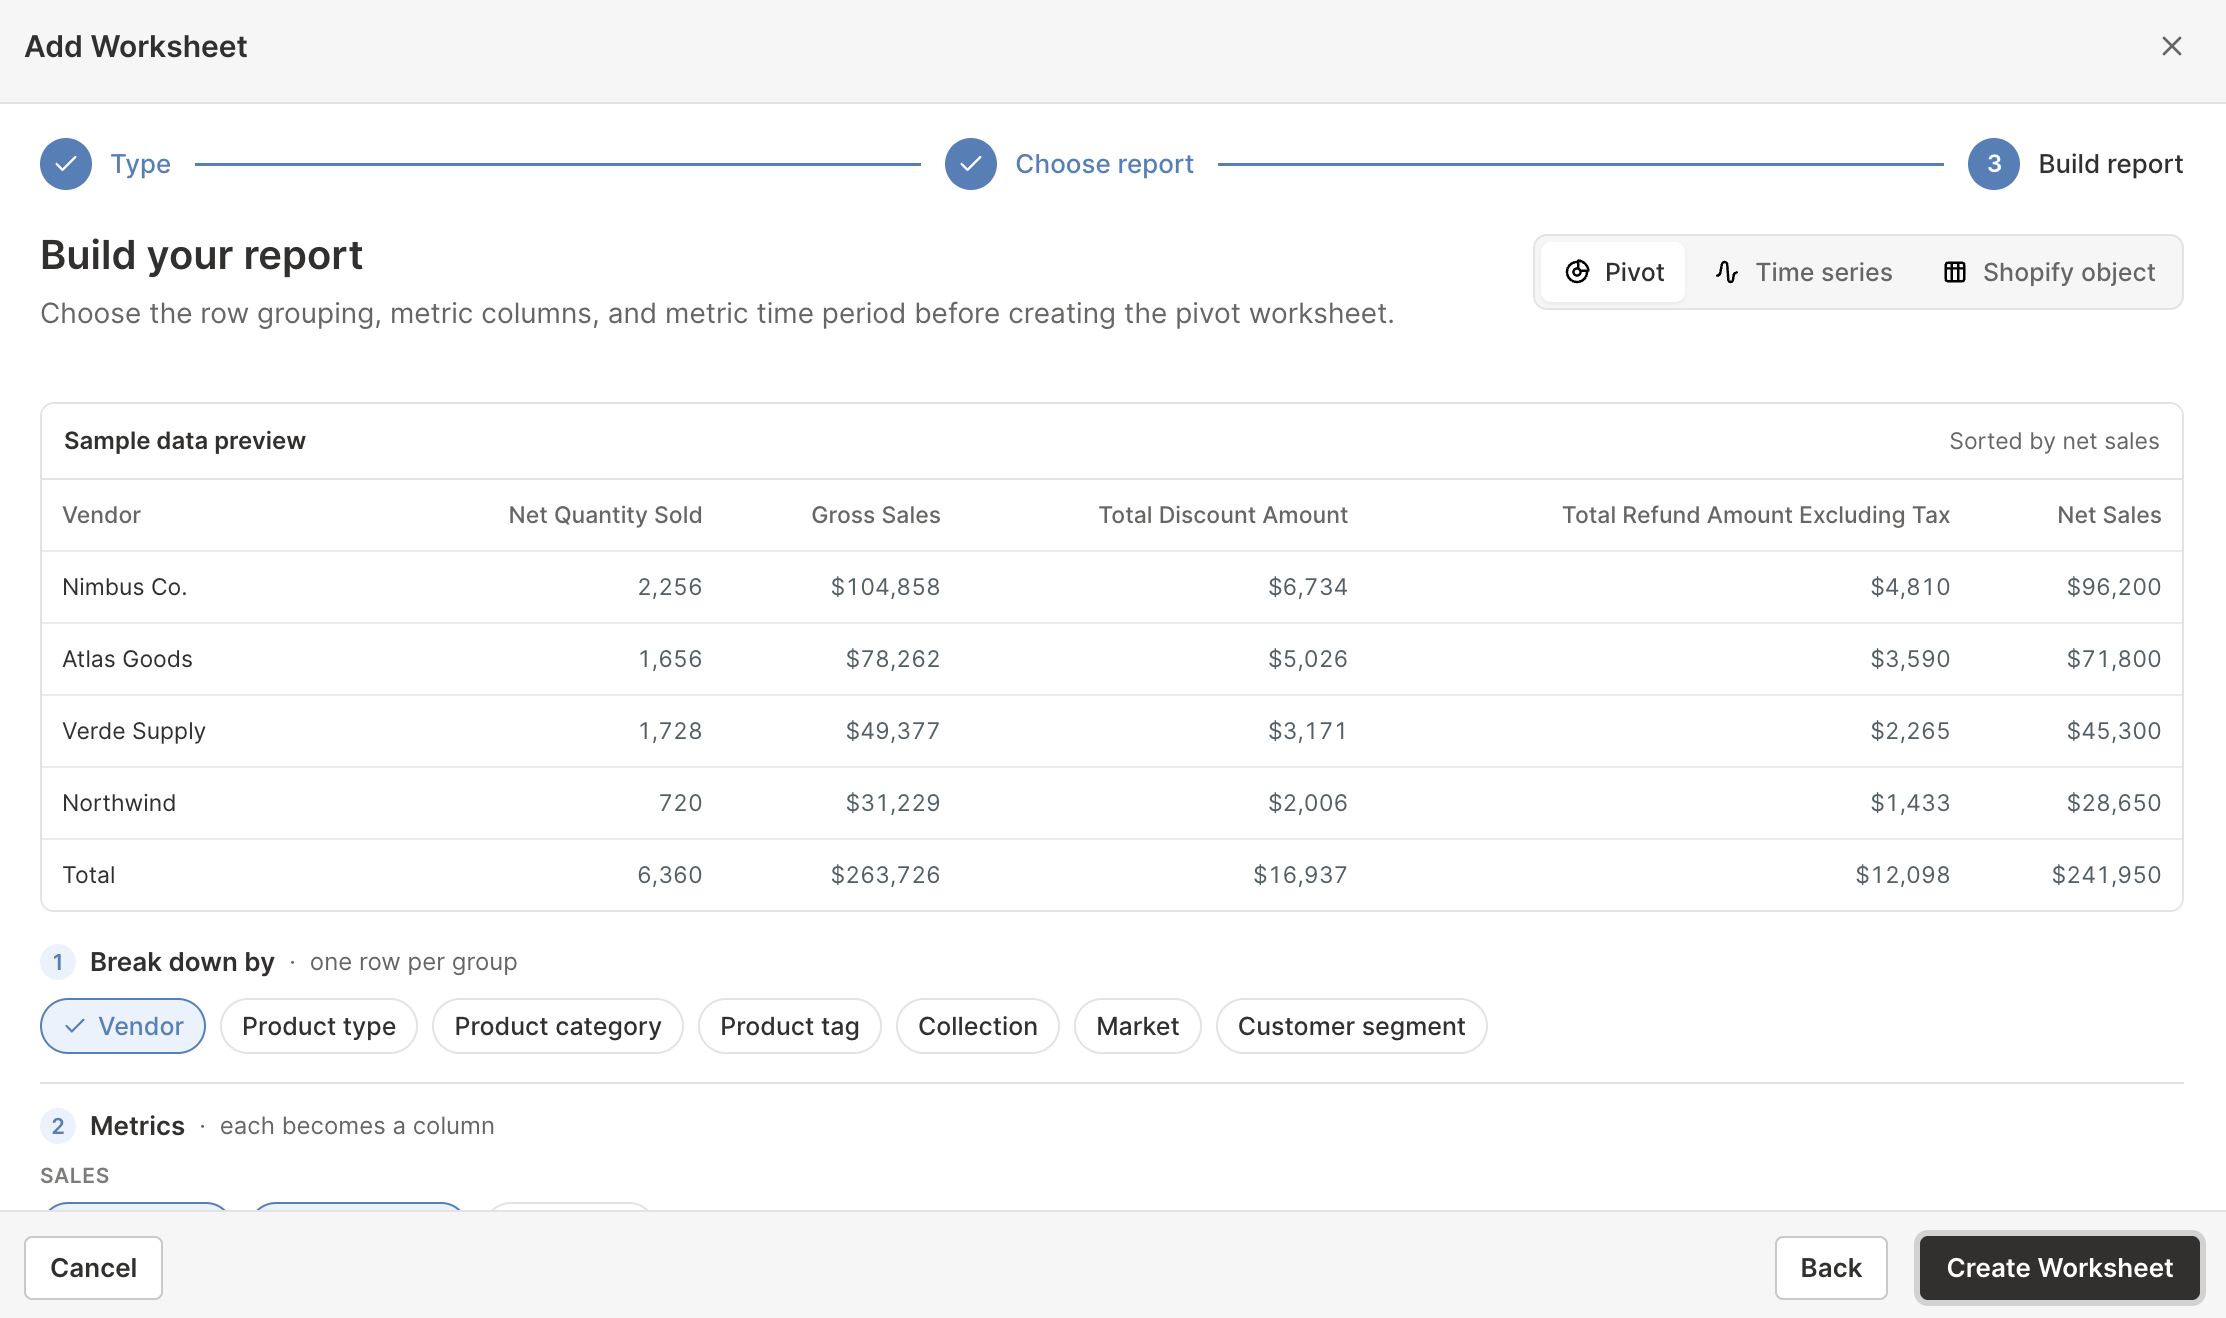
The builder requires a breakdown, at least one metric, and a valid timeframe unless you are creating a completely blank Pivot Table worksheet.
Choose useful metric combinations
A single metric ranks the rows, but a small set of supporting metrics explains the result. Useful combinations include:
Sales quality
- Gross Sales
- Total Discount Amount
- Total Refund Amount Excluding Tax
- Net Sales
This set shows how much of the original merchandise value survived discounts and refunds.
Demand and basket activity
- Net Quantity Sold
- Gross Quantity Sold
- Refunded Quantity
- Orders Count
- Average Order Value
This separates a high-volume group from one driven by a small number of large orders.
Profitability
- Gross Profit
- % Gross Margin
- Amount of Cost of Goods Sold
- Net Sales
Profit metrics require cost-per-item data and are most useful when your Shopify variant costs are complete. See Shopify profit, margin, and COGS analytics.
Choose a timeframe
Every metric column created by the Pivot Table builder uses the same initial timeframe. Choose:
- All time for the complete Shopify analytics history
- Rolling period for a date range that moves with today
- Fixed dates for a campaign, event, or custom comparison period
- Calendar year for a selected year
- Calendar month for a selected month
After creating the worksheet, you can add another metric column with a different timeframe. For example, add Net Sales for this year and Net Sales for last year, then calculate the percentage change in a formula column.
See Shopify analytics timeframes for the difference between rolling and calendar periods.
Add a metric column after creation
In a Pivot Table worksheet, rows define what is being analyzed and columns define what is measured.
A Pivot Table worksheet is a Reporting worksheet, so its headers and bolt buttons are blue rather than the green used on Shopify data worksheets.
- Select an empty column or insert a new one
- Click the button in the column header
- Under Which metric?, select the metric
- Under Over what time period?, choose the timeframe
- Under Limit which orders count, add any optional filters
- Click Save Column
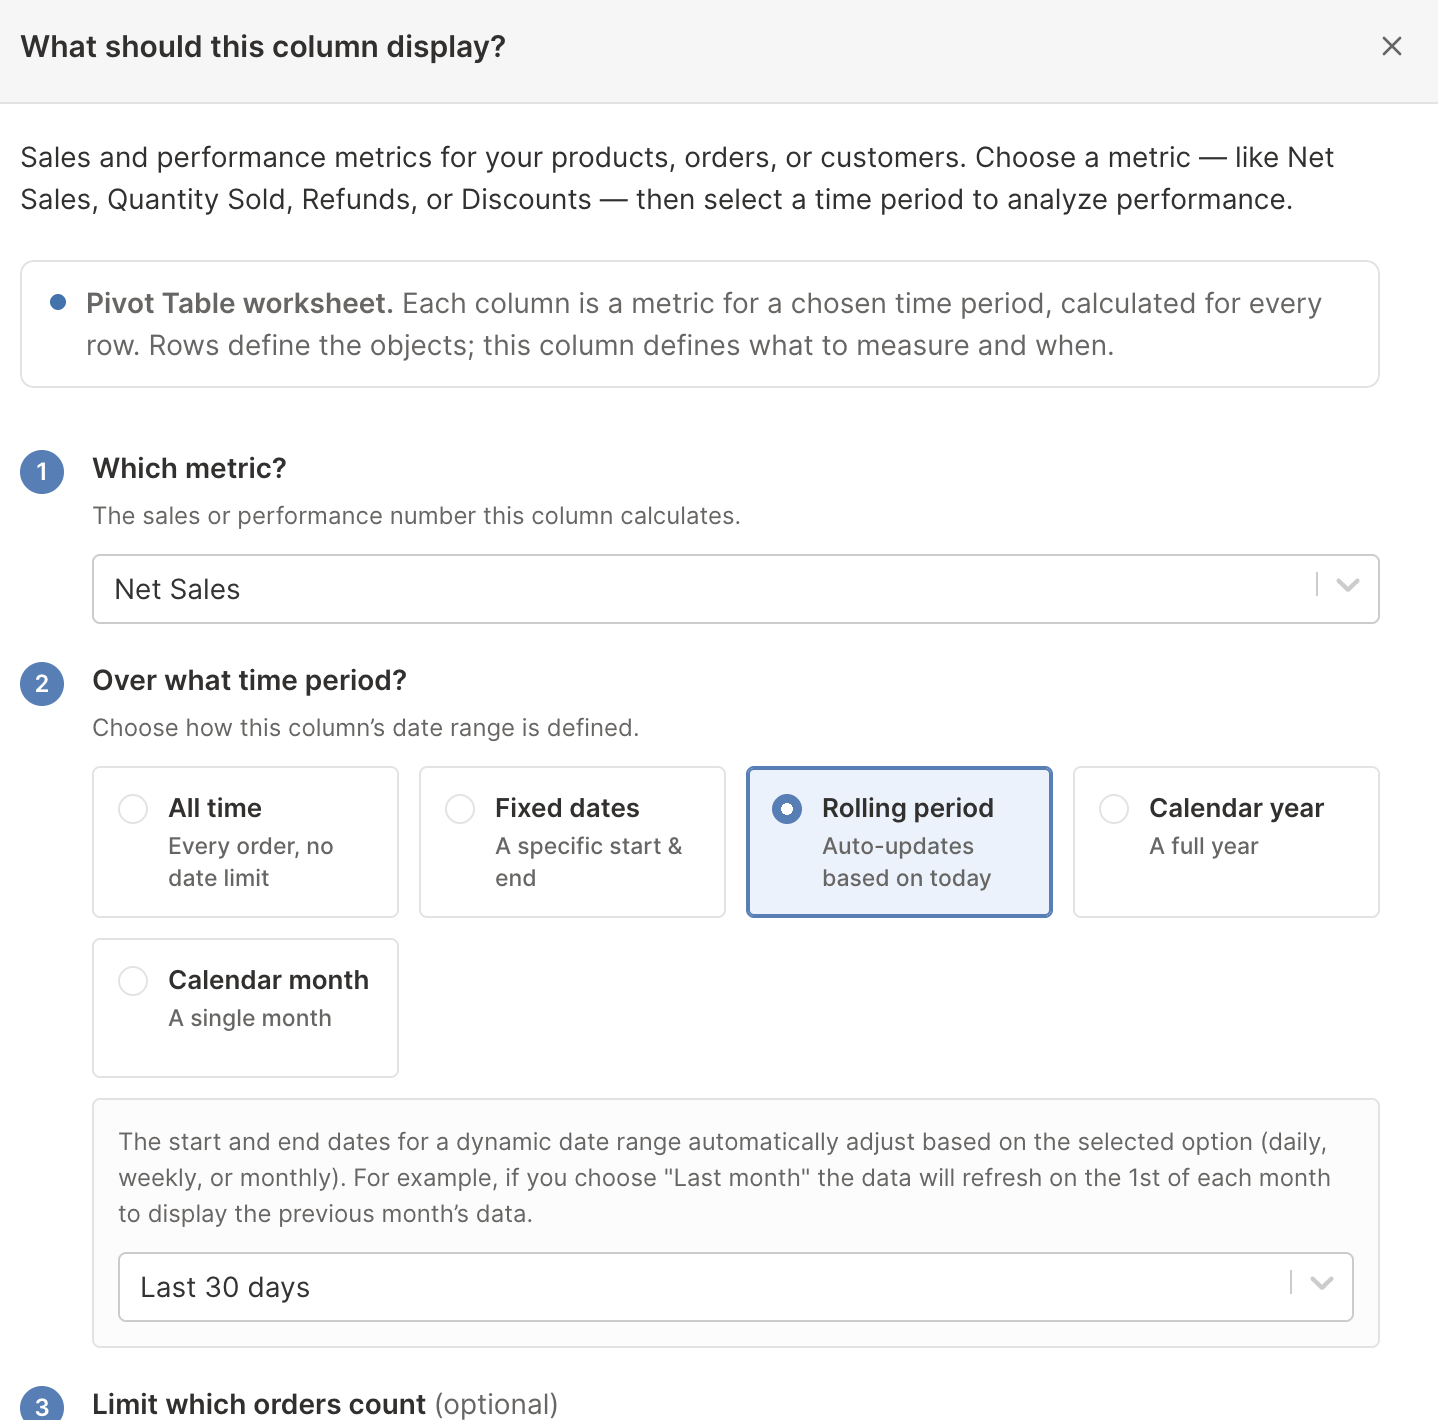
Each column is independent. You can add the same metric several times with different dates or order filters.
Add a custom reporting row
Breakdowns cover the common groupings, but a row can be anything you can describe with a rule. Build your own when the group you care about does not match a single Shopify field.
You can do this in any Pivot Table worksheet, whether you started from a breakdown, a ready-made report, or a blank one. Custom rows sit alongside generated rows in the same report.
- Click the button in an empty row header to open Analytics Row Settings
- Under What do you want to analyze?, choose Products, Product Variants, Collections, Customers, or Store
- Under Which products should this row include?, keep All products for every record, or choose Only matching products to narrow the group
- If you chose matching records, add the conditions. The row includes only records that meet all of them
- Under Row label, keep the automatic name or type your own
- Click Save Row
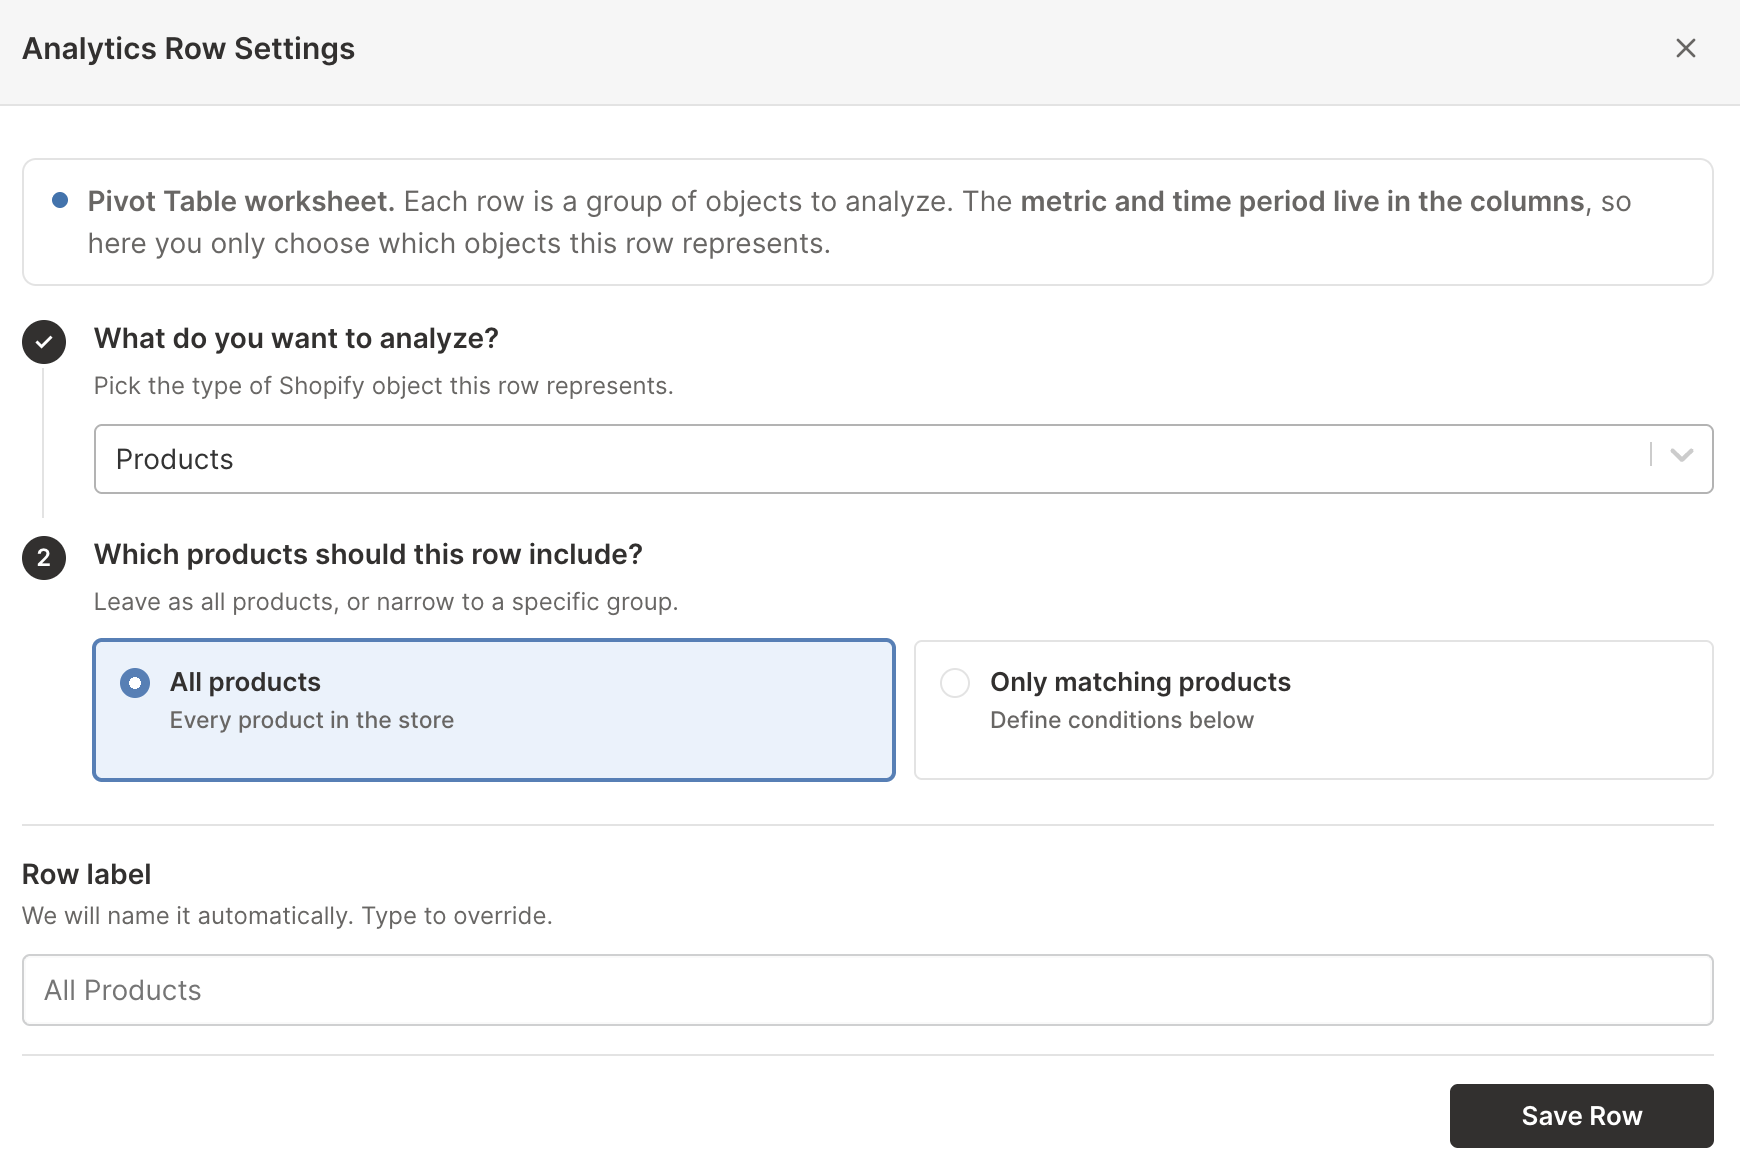
Step 3 adapts to the object you picked, so a Collections row asks which collections to include, and a Customers row asks which customers.
When you choose Only matching products, the row keeps just the records that meet the conditions you write, such as a single vendor’s products.
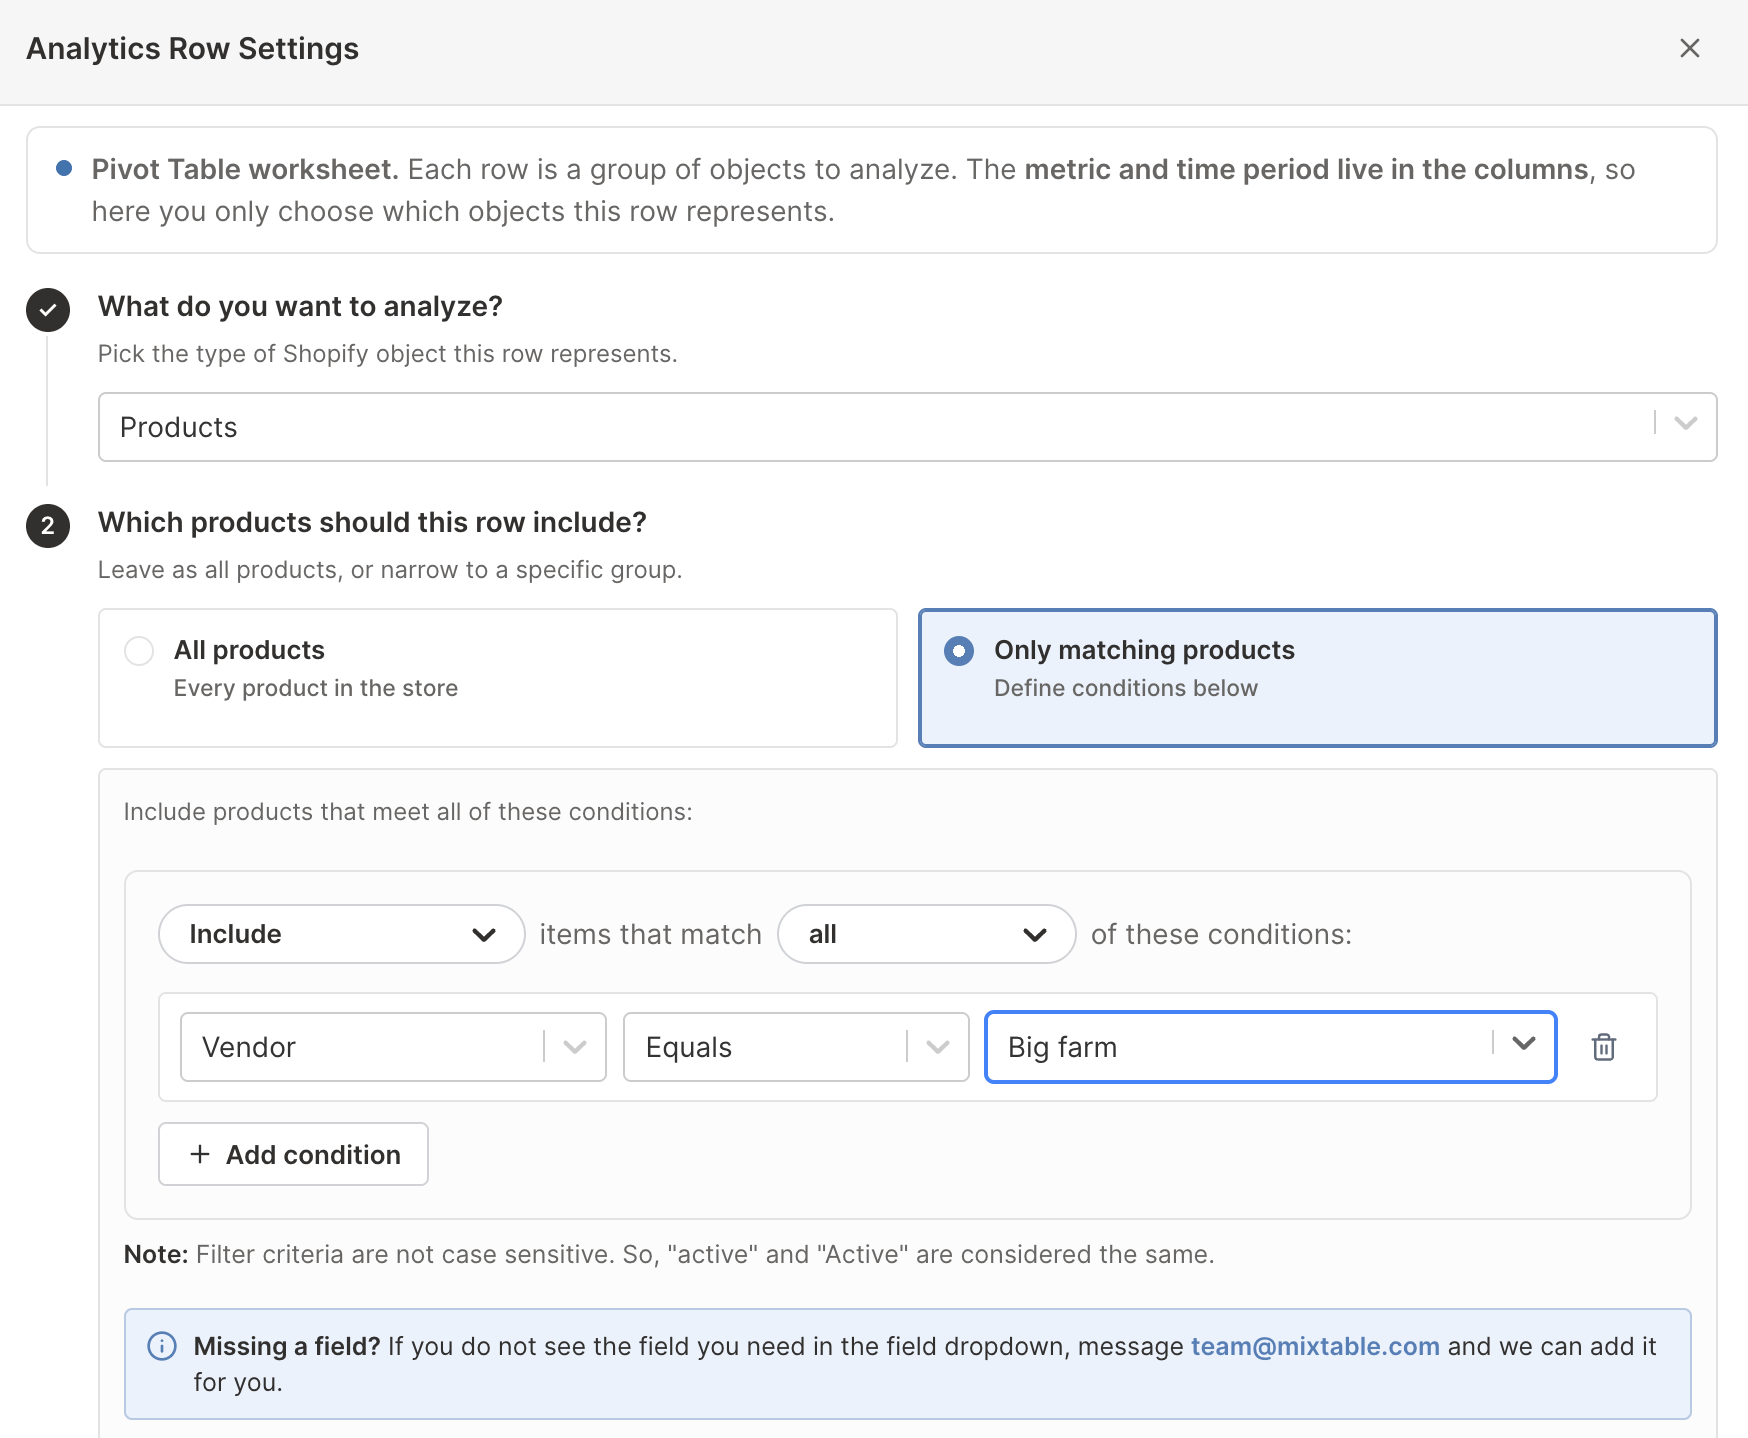
This is where a report stops being a fixed list and starts answering your question. Rows worth building this way include:
- Products from one vendor that also carry a given tag, beside that vendor’s other products
- Variants with a cost above a threshold, beside those below it, to compare your price tiers
- Products created this year, beside everything older
- Customers above a lifetime spend or order count, or in one country
- Products with no category assigned, or variants with no cost recorded
Add one row per group you want to compare, and give each a clear label so the report explains itself.
Conditions use the fields Mixtable stores for analytics: vendor, product type, product category, product tag, and created or updated dates for products; SKU, cost, and dates for variants; the collection and its published or updated dates for collections; and total spent, order count, and default address country or city for customers.
The metric and timeframe still come from the Pivot Table worksheet’s analytics columns. A row only defines the Shopify records included in that group.
Note: A Store row always covers the full Shopify store, so it does not accept record conditions. Use the analytics column’s own filters to narrow a store row.
Understand overlapping rows and totals
Not every Pivot Table breakdown divides the store into exclusive groups:
- One product can have several tags
- One product can belong to several collections
- One customer can qualify for several Shopify segments
The same Shopify order activity can therefore contribute to more than one row. Adding every product-tag, collection, or segment row together may produce more than the store total. Treat those reports as comparisons between groups, not as an accounting reconciliation.
Vendor, product type, and standardized product category are generally closer to mutually exclusive product groupings because each product has one value for those fields.
Make the worksheet easier to act on
After Mixtable creates the report:
- Sort by Net Sales, Gross Margin, refund rate, or another decision metric
- Add formula columns for growth, discount rate, or refund share
- Rename columns so the metric and timeframe are obvious
- Add notes beside rows that need investigation
- Export the worksheet to CSV or the spreadsheet to Excel
For changes over time rather than a single ranked period, create a Time Series worksheet.
Manage Shopify data in a spreadsheet.
Use Mixtable to edit, sync, analyze, import, and export your Shopify store data without CSV juggling.