


Collection Sales Template
Collection Sales Template
The Collection Sales template creates one row per Shopify collection with lifetime sales metrics. Use it to compare the groups behind your merchandising, navigation, campaigns, and seasonal assortments.
What this template tells you
Collections are how you group products for merchandising, but most merchants never see how each group performs as a whole. This template puts them side by side so you can compare assortments rather than individual products:
- Which collections account for most of your sales, and which contribute very little
- Where to point homepage space, email campaigns, and ad budget
- Which collections carry the most discount value relative to their sales
- Which seasonal collections are worth rebuilding next year
These metrics aggregate order activity for the products in each collection. They do not include page views or navigation data, so they show how a collection’s products sold rather than how many shoppers browsed it.
Create the Collection Sales spreadsheet
- Install Mixtable Analytics Spreadsheet
- In Mixtable, click Create Spreadsheet
- Search for or select Collection Sales under Analytics & Reporting
- Create the spreadsheet
Columns included in the template
The template creates a Collection Sales worksheet with:
- Collection Title
- Total Order Count
- Gross Quantity Sold
- Net Quantity Sold
- Returns
- Discounts
- Net Sales
The Returns column is Refund Count, meaning the number of distinct refunded orders associated with the collection.
How to use the template
- Sort by Net Sales to find the collections contributing the most retained product sales
- Compare Total Order Count with Net Sales to tell high-order-volume collections from high-value ones
- Compare Gross Quantity Sold with Net Quantity Sold to see how much returns reduce each collection’s unit volume
- Review Discounts beside Net Sales to find collections whose sales lean heavily on discounted orders
- Add collection handle, product count, collection type, and sort order for merchandising context
Product count is worth adding early. A collection holding 400 products and producing very little sales tells you the group is not pulling its weight, which is a prompt to review how it is built and where it appears.
Add more metrics or a different timeframe
-
Open your Collection Sales worksheet, then select an empty column or insert a new one. Empty columns have a non-green header; a green header means the column is already linked to Shopify data
-
Click the
 button in the column header
 -
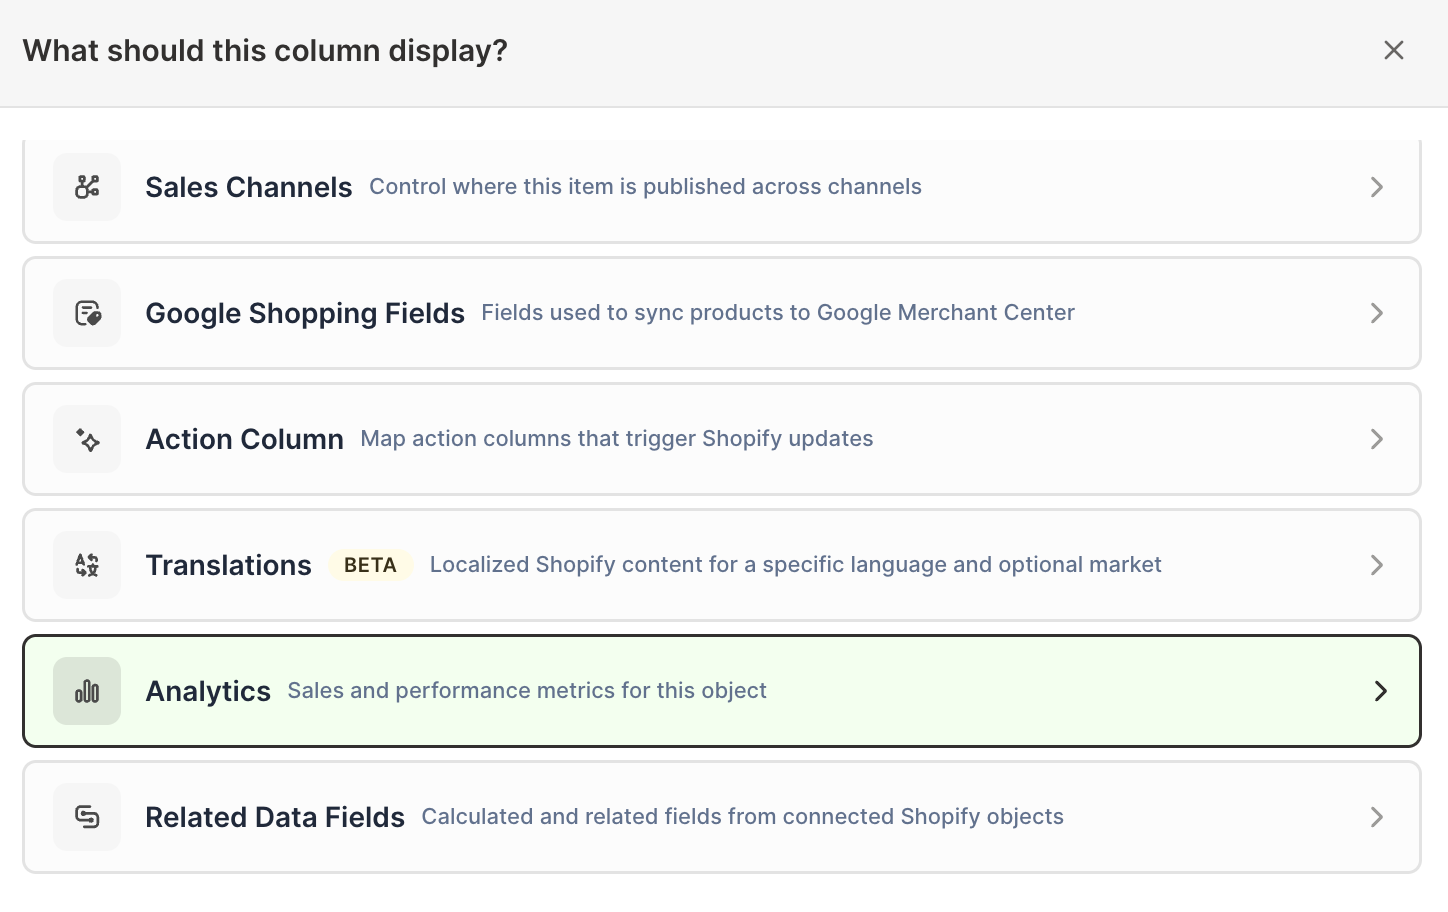
Choose Analytics
-
Under Which metric?, select the metric you want
-
Under Over what time period?, choose All time, Fixed dates, Rolling period, Calendar year, or Calendar month
-
Under Limit which orders count, add any optional filters supported by the metric
-
Click Save Column
Adding the same metric over a recent window, beside the template’s lifetime figures, is what turns this into a seasonal comparison rather than a static ranking.
You can also add an Reporting worksheet and choose Collection sales & refund rate for a ready-made collection worksheet that includes collection details, Net Sales, Gross Sales, Net Quantity Sold, Orders Count, and Percent of Orders Refunded.
Understand overlapping collections
A Shopify product can belong to more than one collection, so its sales can contribute to more than one collection row. Use this template to compare collections against each other, not to reconcile against your store total.
For more reporting options, see Shopify Collection Analytics.
Manage Shopify data in a spreadsheet.
Use Mixtable to edit, sync, analyze, import, and export your Shopify store data without CSV juggling.