Shopify Collection Analytics
Shopify Collection Analytics
Collections are how you merchandise: the groups behind your navigation, your homepage rows, your campaigns, and your seasonal assortments. Collection analytics tell you whether those groups are actually working.
With Mixtable, you load your Shopify collections into a worksheet, one row per collection, then add calculated performance metrics beside the collection fields you already use to manage them.
What collection reporting tells you
Product-level reports rank individual products. Collection-level reports roll that same order activity up to the groups you merchandise with, so you can compare assortments instead of items.
Once each collection is a row with its own metrics, you can:
- See which collections account for most of your sales, and which contribute very little
- Compare this season’s collection against the same one last year
- Find collections whose products attract an unusually high share of refunds
- Decide which collections deserve more ad spend, email, and homepage space
- Check whether a large collection is productive in proportion to its size
Because the metrics sit on a Collections worksheet, the collection fields are right there too. Product count beside Net Sales is a quietly useful pairing: it shows which collections carry a lot of products for very little sales, which is a prompt to review how they are built.
Note: These metrics aggregate order activity for the products in each collection. They do not include collection page views, navigation clicks, or conversion tracking, so they show how a collection’s products sold, not how many shoppers saw the collection or whether your navigation led them there.
Start with the Collection sales & refund rate report
This is the fastest way to get a working collection report. It builds a Collections worksheet and adds the analytics columns for you.
- Install Mixtable Analytics Spreadsheet and open your spreadsheet
- Click the + button beside the worksheet tabs
- Select Reporting worksheet, then click Continue
- Under Shopify data worksheet with analytics columns, select Collection sales & refund rate, then click Continue
- Review the Shopify object, columns, analytics metrics, and row settings
- Click Create Worksheet
The ready-made worksheet includes collection details such as title, handle, product count, and sort order. It also adds:
- Net Sales
- Gross Sales
- Net Quantity Sold
- Orders Count
- Percent of Orders Refunded
You can change the selected fields, adjust the metrics, and decide whether to load every collection or only collections that match your rules before creating the worksheet.
Build a Collections worksheet from scratch
Use this route when you want to choose the collection fields yourself before adding any metrics.
- Click the + button beside the worksheet tabs
- Select Shopify data worksheet
- Under Products & Inventory, choose Collection
- Choose the standard fields, all available fields, or a custom field selection
- Create the worksheet and wait for your Shopify collections to finish loading
Collection fields include Title, Handle, Description, Sort Order, Collection Type, Product Count, Template Suffix, and Updated At.
You can load every collection, or build a conditional worksheet so only collections matching your rules appear. A conditional worksheet keeps itself current as collections move in and out of your rules, which is handy for reporting on just your seasonal or campaign collections.
Add analytics columns to a Collections worksheet
Each analytics column calculates one metric, over one timeframe, for every collection row.
-
Open a Collections worksheet, then select an empty column or insert a new one. Empty columns have a non-green header; a green header means the column is already linked to Shopify data
-
Click the
 button in the column header
 -
Choose Analytics
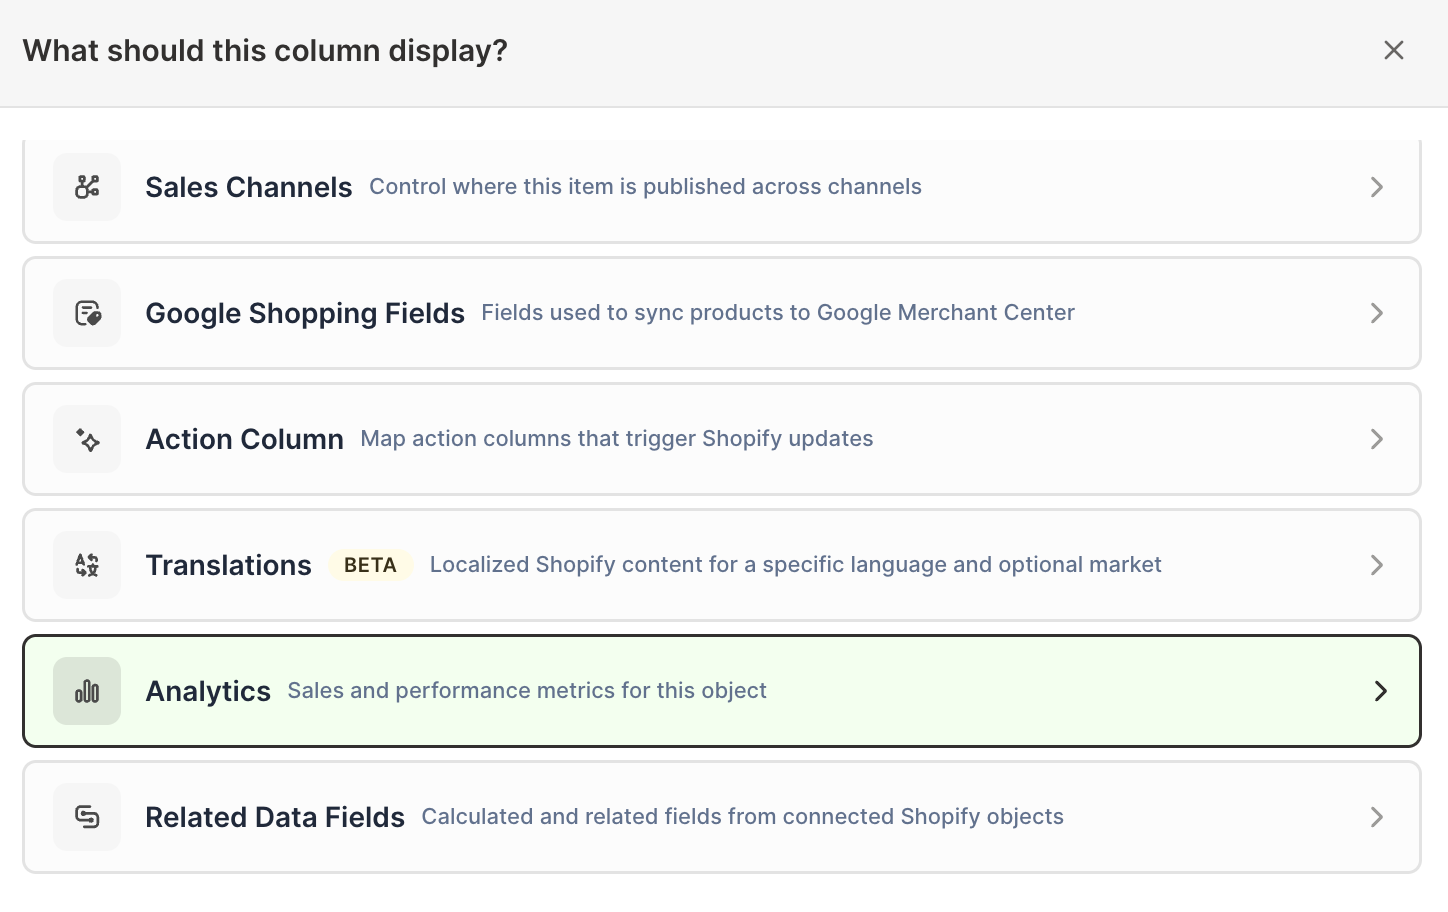
-
Under Which metric?, select the metric you want to calculate
-
Under Over what time period?, choose All time, Fixed dates, Rolling period, Calendar year, or Calendar month
-
Under Limit which orders count, add any optional filters supported by the metric
-
Click Save Column
Repeat for each metric you want. Collection worksheets support:
- Net Sales and Gross Sales
- Net Quantity Sold, Gross Quantity Sold, and Refunded Quantity
- Orders Count
- Total Refund Amount Excluding Tax, Refund Count, and Percent of Orders Refunded
- Total Discount Amount and Total Tax Amount
Supported filters include Customer segment, Customer’s country, Has a discount, Repeat customer, Fulfillment status, Order source, Order app, Publication, Retail location, Discount code, and first-touch or last-touch attribution values.
Compare timeframes and slices side by side
The real power of analytics columns is adding the same metric more than once with different settings, since every column is independent.
Two patterns worth knowing:
- Season over season. Add Net Sales twice, once for this calendar year and once for last, then add a formula column for the percentage change. Collections that are fading show up immediately
- Channel or audience split. Add Net Sales twice with the same timeframe, filtered to two different order sources or customer segments. This tells you which collections work for which audience
Name each column clearly, for example Net Sales · 2026 and Net Sales · 2025, so the metric, timeframe, and any filter stay obvious to whoever opens the spreadsheet later.
Because the result is a normal worksheet, you can sort by any metric to rank your collections, add your own formulas, and export the whole thing to Excel or CSV.
Use the Collection Sales template
If you would rather start a whole new spreadsheet than add a worksheet, create one from the Collection Sales template. It provides a ready-made collection worksheet with order count, gross and net quantities, refunds, discounts, and Net Sales. See Collection Sales Template for the full column list.
Understand collection totals
A Shopify product can belong to more than one collection, so its activity can contribute to more than one collection row. That is the correct behavior for comparing collections against each other, but it means collection rows will not add up to your store total. Use these reports to rank and compare, not to reconcile.
Manage Shopify data in a spreadsheet.
Use Mixtable to edit, sync, analyze, import, and export your Shopify store data without CSV juggling.