


Shopify Orders Net Profit Analytics
Shopify Orders Net Profit Analytics
Orders Net Profit estimates the profit a product variant earned by subtracting the variant’s cost from its net sales value, for the quantity sold after returns.
How Shopify Orders Net Profit is calculated
Orders Net Profit = Net sales value - (Current variant cost × Quantity sold)
Shopify does not store the cost per item as it stood on the day of the order, so Mixtable uses the variant’s current cost. That makes this an estimate, and variants with no cost set cannot produce a normal result.
Why your bestsellers are not always your best products
Sales rankings reward whatever moves the most money, and that is not the same as whatever makes you the most. Plenty of stores discover that a mid-table product with a strong margin contributes more to the bottom line than the discounted hero product at the top of the list.
Orders Net Profit puts that comparison in front of you. Use it to:
- Rank variants by what they contribute, not by what they gross
- Decide which products deserve ad spend, homepage space, and stock
- Catch variants that sell well but earn almost nothing after discounting
- Sanity check a promotion before you repeat it
This is a product-variant metric. Add it to a Products (with variants) worksheet when you want profit beside SKU, price, cost, inventory, and other Shopify variant fields.
Before you rely on the numbers
The calculation depends on Shopify’s Cost Per Item value, so it is only as good as the cost data in your store.
- Variants without a cost do not produce a profit value
- Mixtable uses the variant’s current cost, because Shopify does not provide the historical cost that applied when each order was placed
- Updating Cost Per Item therefore changes profit figures for earlier orders too
Orders Net Profit is a merchandise-level estimate. It does not subtract shipping expenses, payment fees, marketing costs, taxes, duties, or other operating expenses, so treat it as a way to compare products against each other rather than as your true bottom line.
Add Orders Net Profit to a variant worksheet
-
Open a Products (with variants) worksheet, then select an empty column or insert a new one. Empty columns have a non-green header; a green header means the column is already linked to Shopify data
-
Click the
 button in the column header
 -
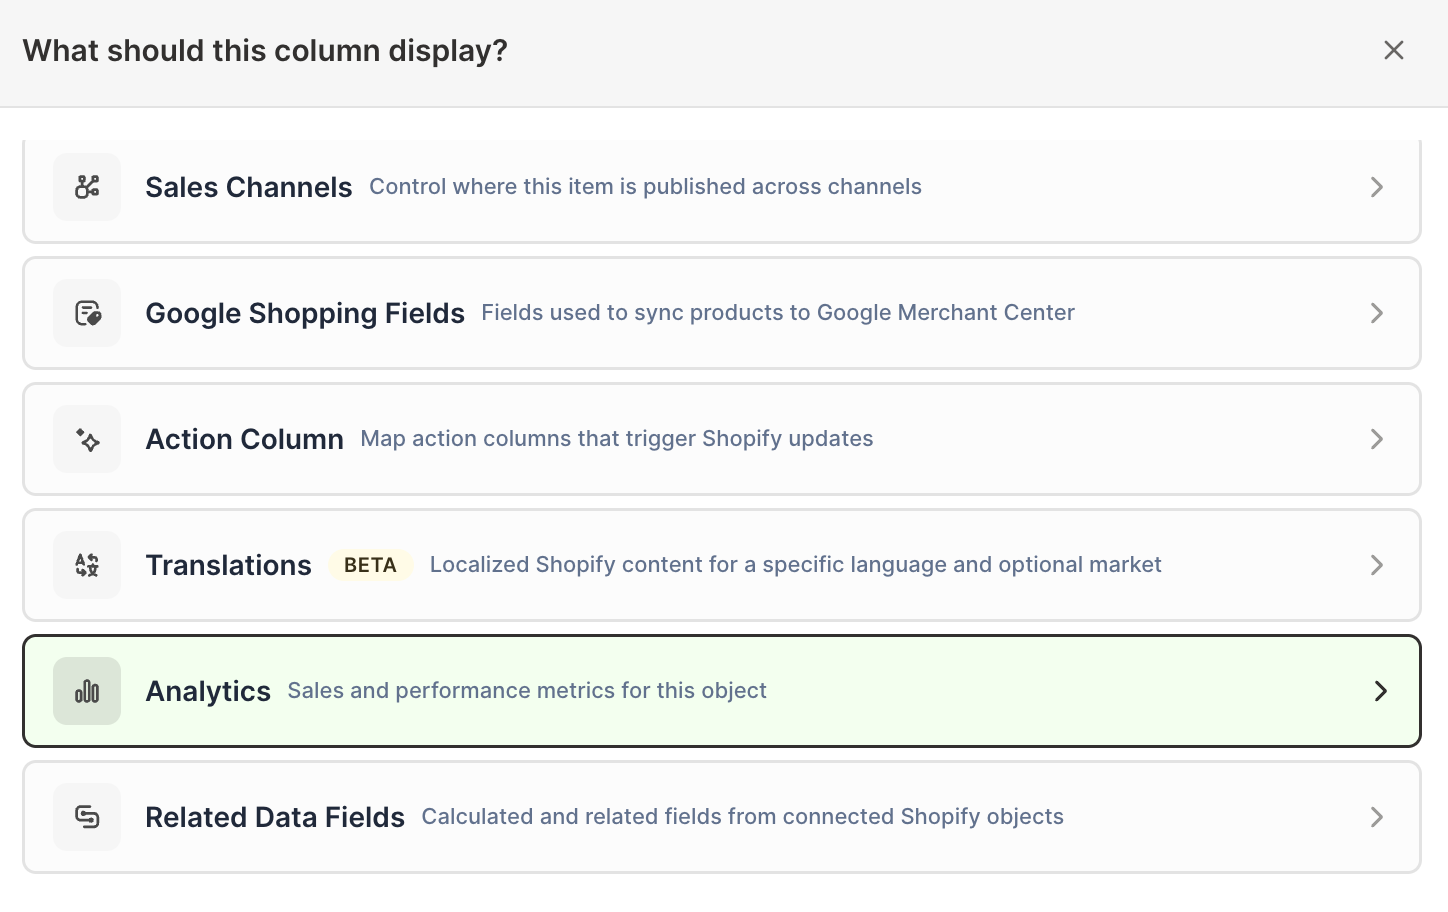
Choose Analytics
-
Under Which metric?, select Orders Net Profit
-
Under Over what time period?, choose All time, Fixed dates, Rolling period, Calendar year, or Calendar month
-
Under Limit which orders count, add any optional filters supported by the metric
-
Click Save Column
Keep Cost Per Item, Net Sales, Net Quantity Sold, and inventory visible beside the result. When one variant out-earns another, those columns show you whether the reason was price, cost, volume, or returns.
Start with the Variant margin & inventory report
For a broader profitability view, add an Reporting worksheet and select Variant margin & inventory under Shopify data worksheet with analytics columns. That ready-made report combines current price, cost, and inventory with:
- Amount of Cost of Goods Sold
- Gross Profit
- % Gross Margin
- Net Sales
- Net Quantity Sold
Margin and profit answer different questions, so it helps to read them together. A high-margin variant that barely sells may contribute less than a lower-margin variant that sells constantly. You can add an Orders Net Profit column to that worksheet if you want the per-variant total alongside the margin percentage.
Pivot Table and Time Series availability
Orders Net Profit is currently available as an analytics column on product-variant worksheets. The Pivot Table and Time Series builders offer other profit measures, including Gross Profit, % Gross Margin, and Amount of Cost of Goods Sold where supported, so you can still compare profitability by vendor, category, or collection.
Manage Shopify data in a spreadsheet.
Use Mixtable to edit, sync, analyze, import, and export your Shopify store data without CSV juggling.