
Shopify Field History, Conditional Formatting, and Inventory Analytics
On this page
- A history of every change to your Shopify fields
- Color cells with conditional formatting
- More formatting tools on the toolbar
- Inventory analytics for Shopify
- Print a pick list or any worksheet
- Time Series by day and by week
- Translations for one market in your default language
- See a row’s whole Shopify record in Details
- A redesigned spreadsheet screen
- Sync with Shopify from the top right
This release brings three big additions: a history of every change to your Shopify fields, conditional formatting that makes the rows needing attention stand out, and inventory analytics for your stock levels, stockouts, sell-through, and dead stock. Alongside them, you’ll find new formatting tools, printing for any worksheet, Time Series reports by day and week, and a redesigned spreadsheet screen with one place to sync with Shopify. Here’s what’s new from September and early October 2026.
Most of these changes apply in every Mixtable app, and sending edits to Shopify needs Mixtable Spreadsheet Editor. Inventory analytics and the new report options are part of Mixtable Analytics Spreadsheet.
A history of every change to your Shopify fields
Cell history and Row history have been rebuilt. Each change to a tracked Shopify field is recorded once, whether it came in from Shopify or went out with a sync, and a change made in Mixtable shows who clicked Sync and the spreadsheet, worksheet, and cell it came from. To open them, right-click a row number and choose Row history or Cell history, use the Row menu, or right-click a cell and choose View cell history.
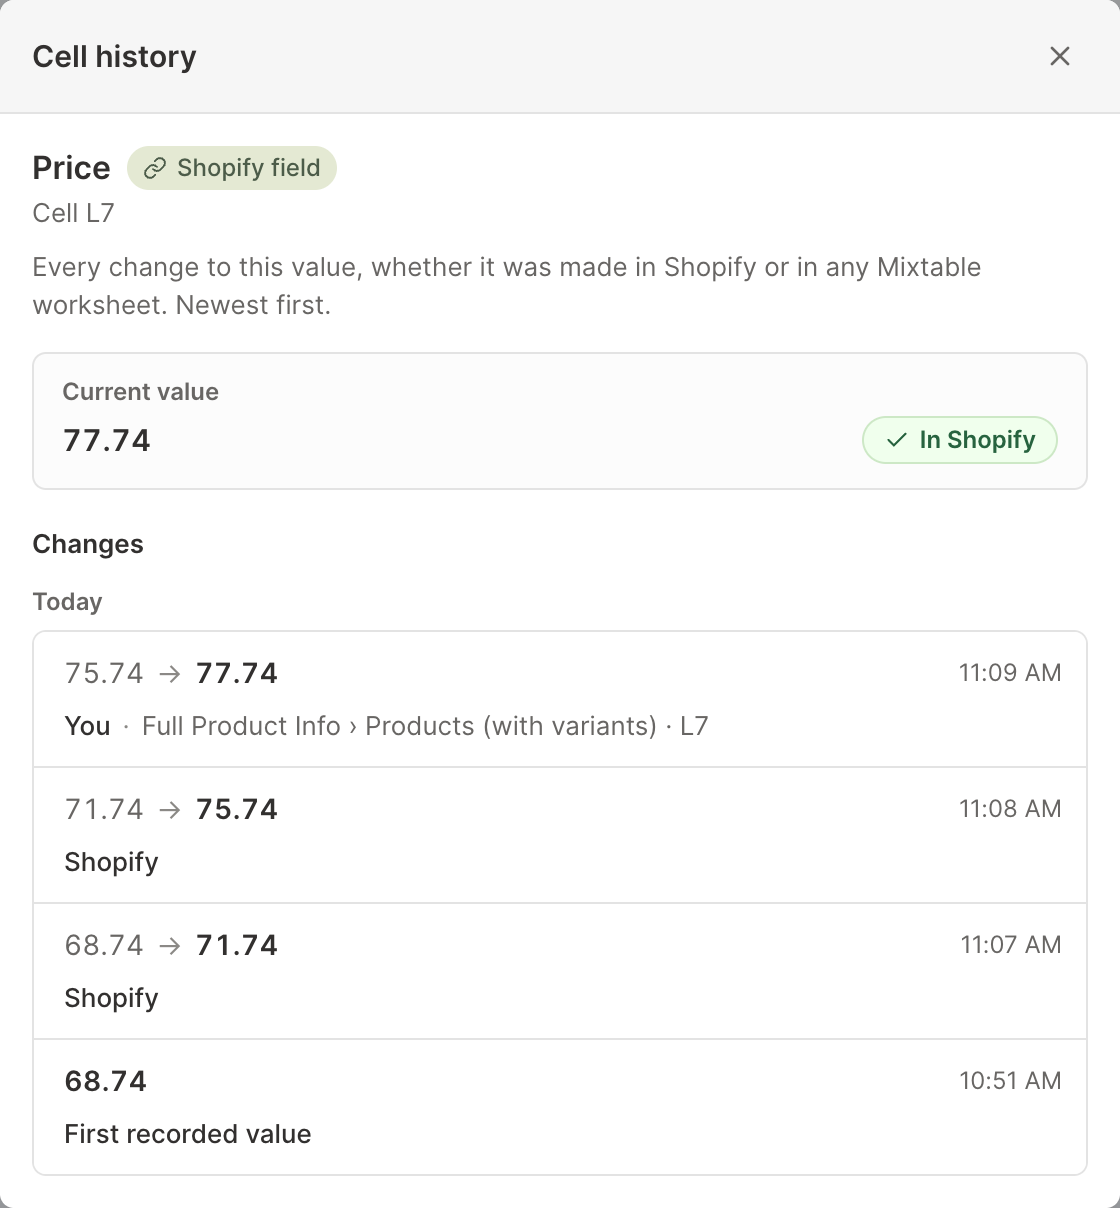
History covers cells linked to Shopify: the fields a sync can change, plus metafields, collections, sales channels, market prices, and translations. It doesn’t include inventory quantities or cells that aren’t linked to Shopify, and nothing is recorded while you type. A change is recorded when you sync it, or when it arrives from Shopify.
Mixtable also records every variant’s price, cost, and fixed market prices from the first download, even if no worksheet shows them, so you have a price and cost history for every variant.
Read more: View the history of your Shopify data changes and View Shopify product price history
Color cells with conditional formatting
Conditional formatting colors a column’s cells based on their values, so the rows that need attention stand out: low stock in red, a missing SEO title in amber, a recent order in green. Choose Conditional formatting… from the Column menu, or right-click a column letter, then add rules that read like sentences, such as “Color a cell when its value… is less than 5”.
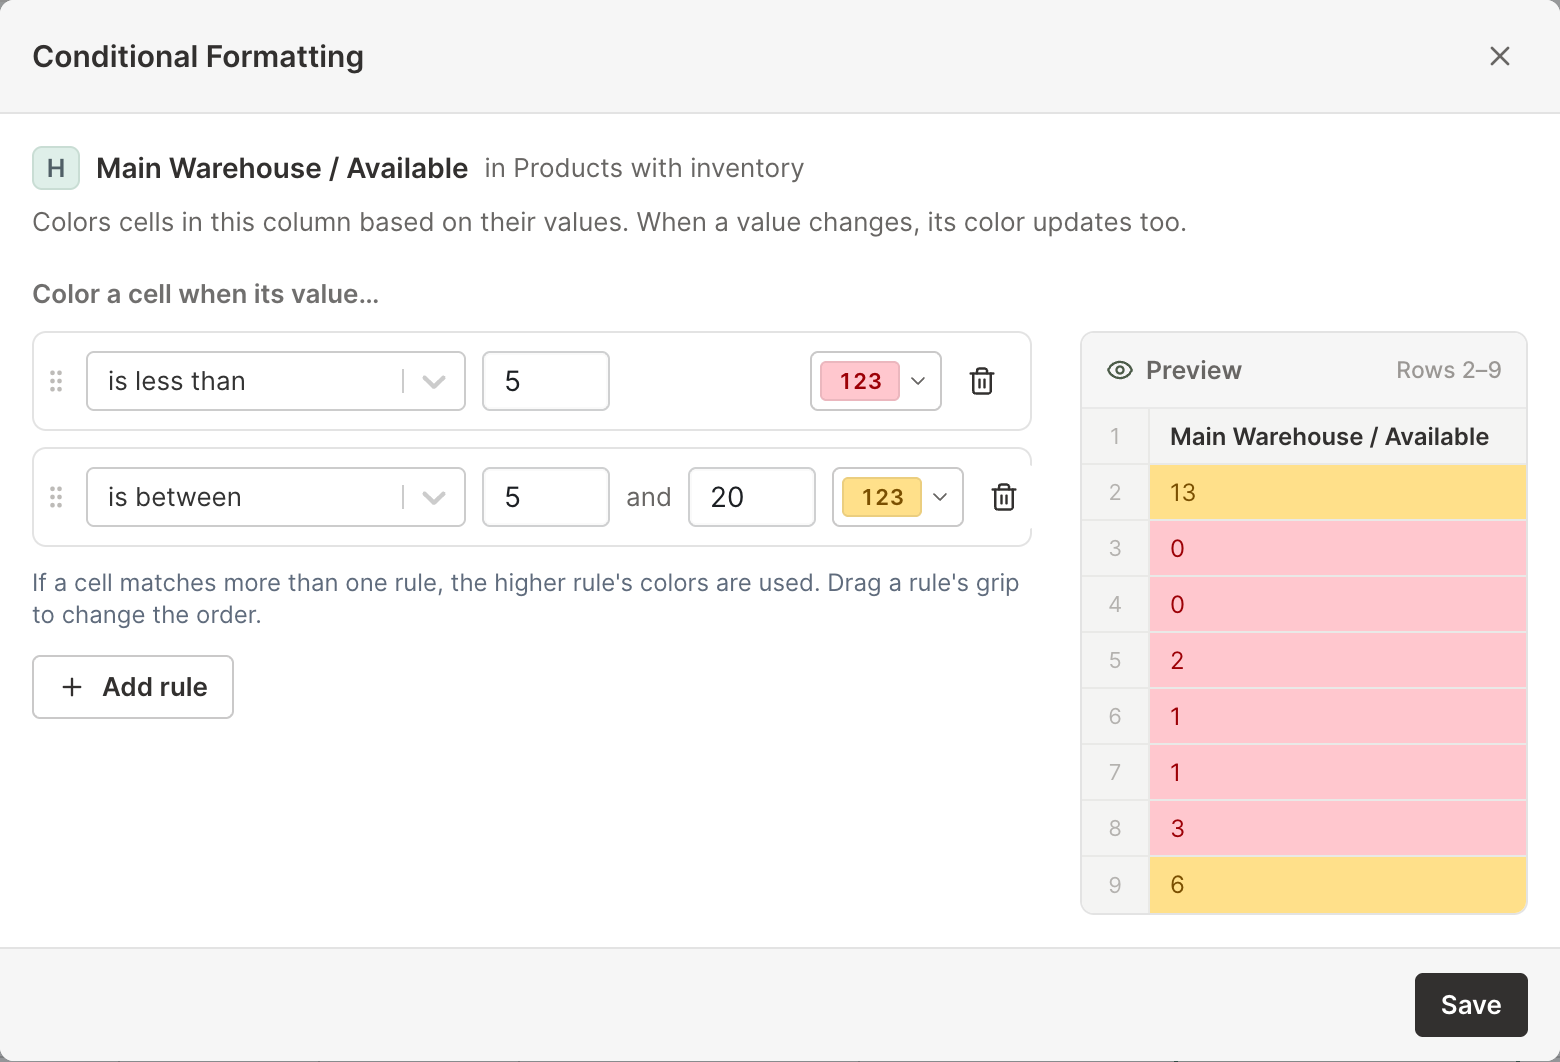
Rules can check numbers (less than, between, and more), text (contains, starts with, and more), dates (today, the last 7 days, this month, or last month), or whether a cell is empty. Each rule uses one of six ready-made styles or your own fill and text colors. A column can have up to 20 rules, the top matching rule wins, and colors update as values change, for example after a sync. When you export to Excel, the rules come along.
Read more: Color cells with conditional formatting
More formatting tools on the toolbar
The toolbar has new formatting controls: font size, borders, a number format menu (General, Number, Percent, currencies, and dates), buttons to add or remove decimal places, autofit for column widths and row heights, and a button that clears formatting. They sit beside the bold, italic, alignment, and color buttons you already know.

For more options, choose More formats… in the number format menu, or right-click a column letter and choose Type & format…. This window, once called Format Column, sets what a column holds: currency, a date, a number, a percent, text, or a dropdown list.
Read more: Format cells and columns
Inventory analytics for Shopify
Mixtable Analytics Spreadsheet now has 18 inventory metrics, so you can see which products sit on the shelf without selling, which ones ran out and roughly what that cost you, and how many days of stock you have left. Mixtable works them out from your store’s daily inventory history in Shopify, plus your orders for the metrics that involve sales.
- Stock levels and value: opening and closing stock, stock change, average daily stock, and closing value at cost and at retail
- Stockouts: days in and out of stock, in-stock rate, out-of-stock variants, and estimated lost sales
- Sell-through and dead stock: sell-through rate, inventory turnover, days of stock left, and the units and cost of stock that isn’t selling
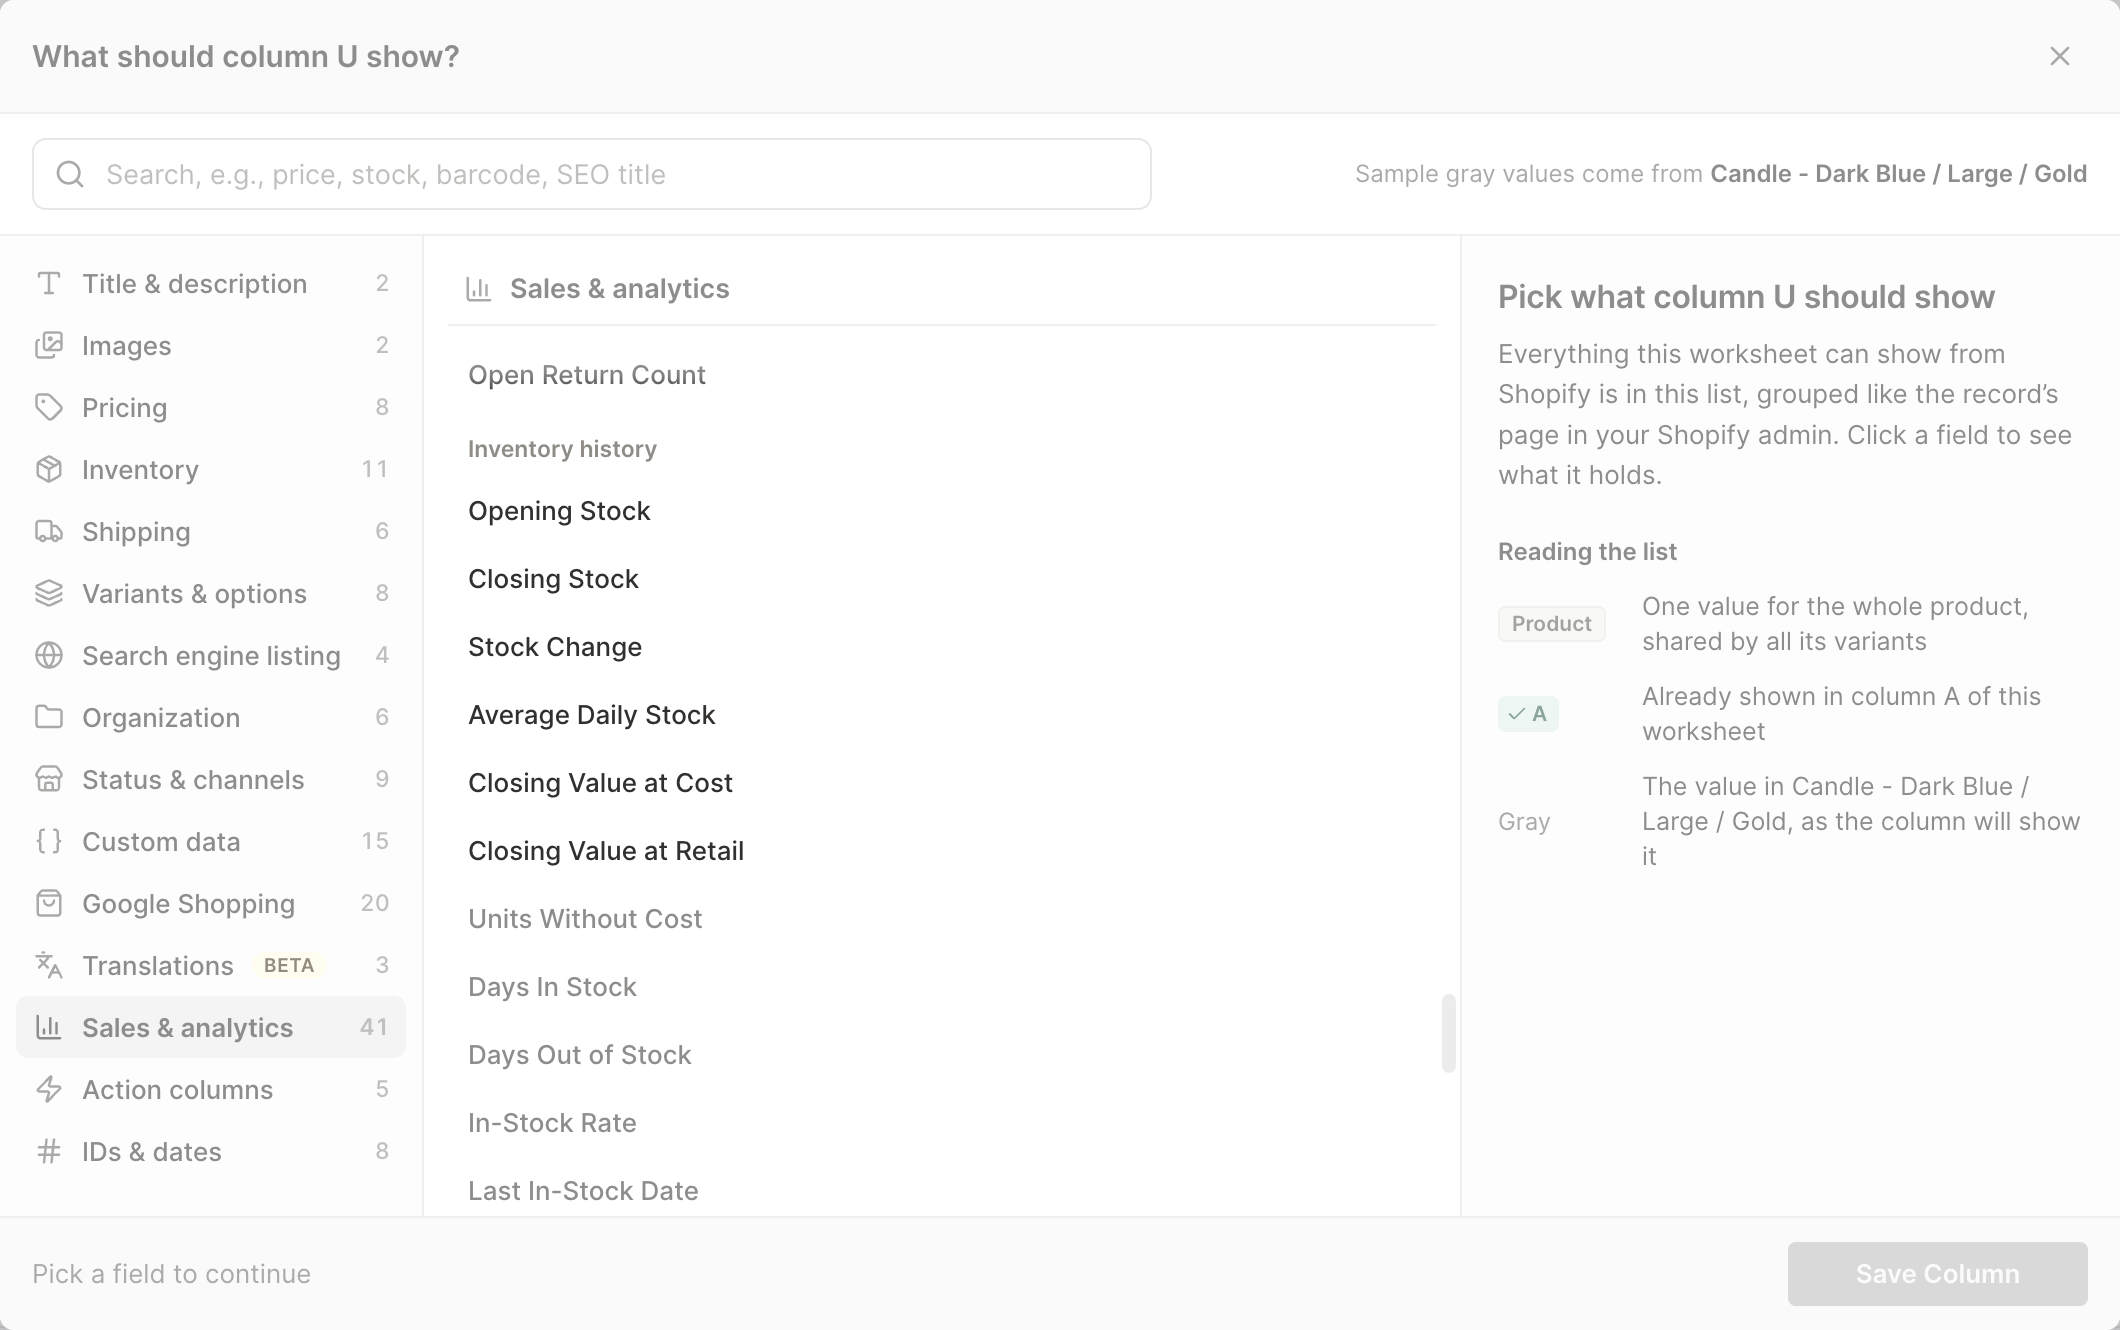
Add them as analytics columns on Products and Collections worksheets, or in Pivot Table and Time Series worksheets. They’re listed in a new Inventory history group, and you can choose which stock locations count. The first time, Mixtable downloads your inventory history in the background, and the numbers fill in once it’s ready.
Read more: Inventory analytics for Shopify
Print a pick list or any worksheet
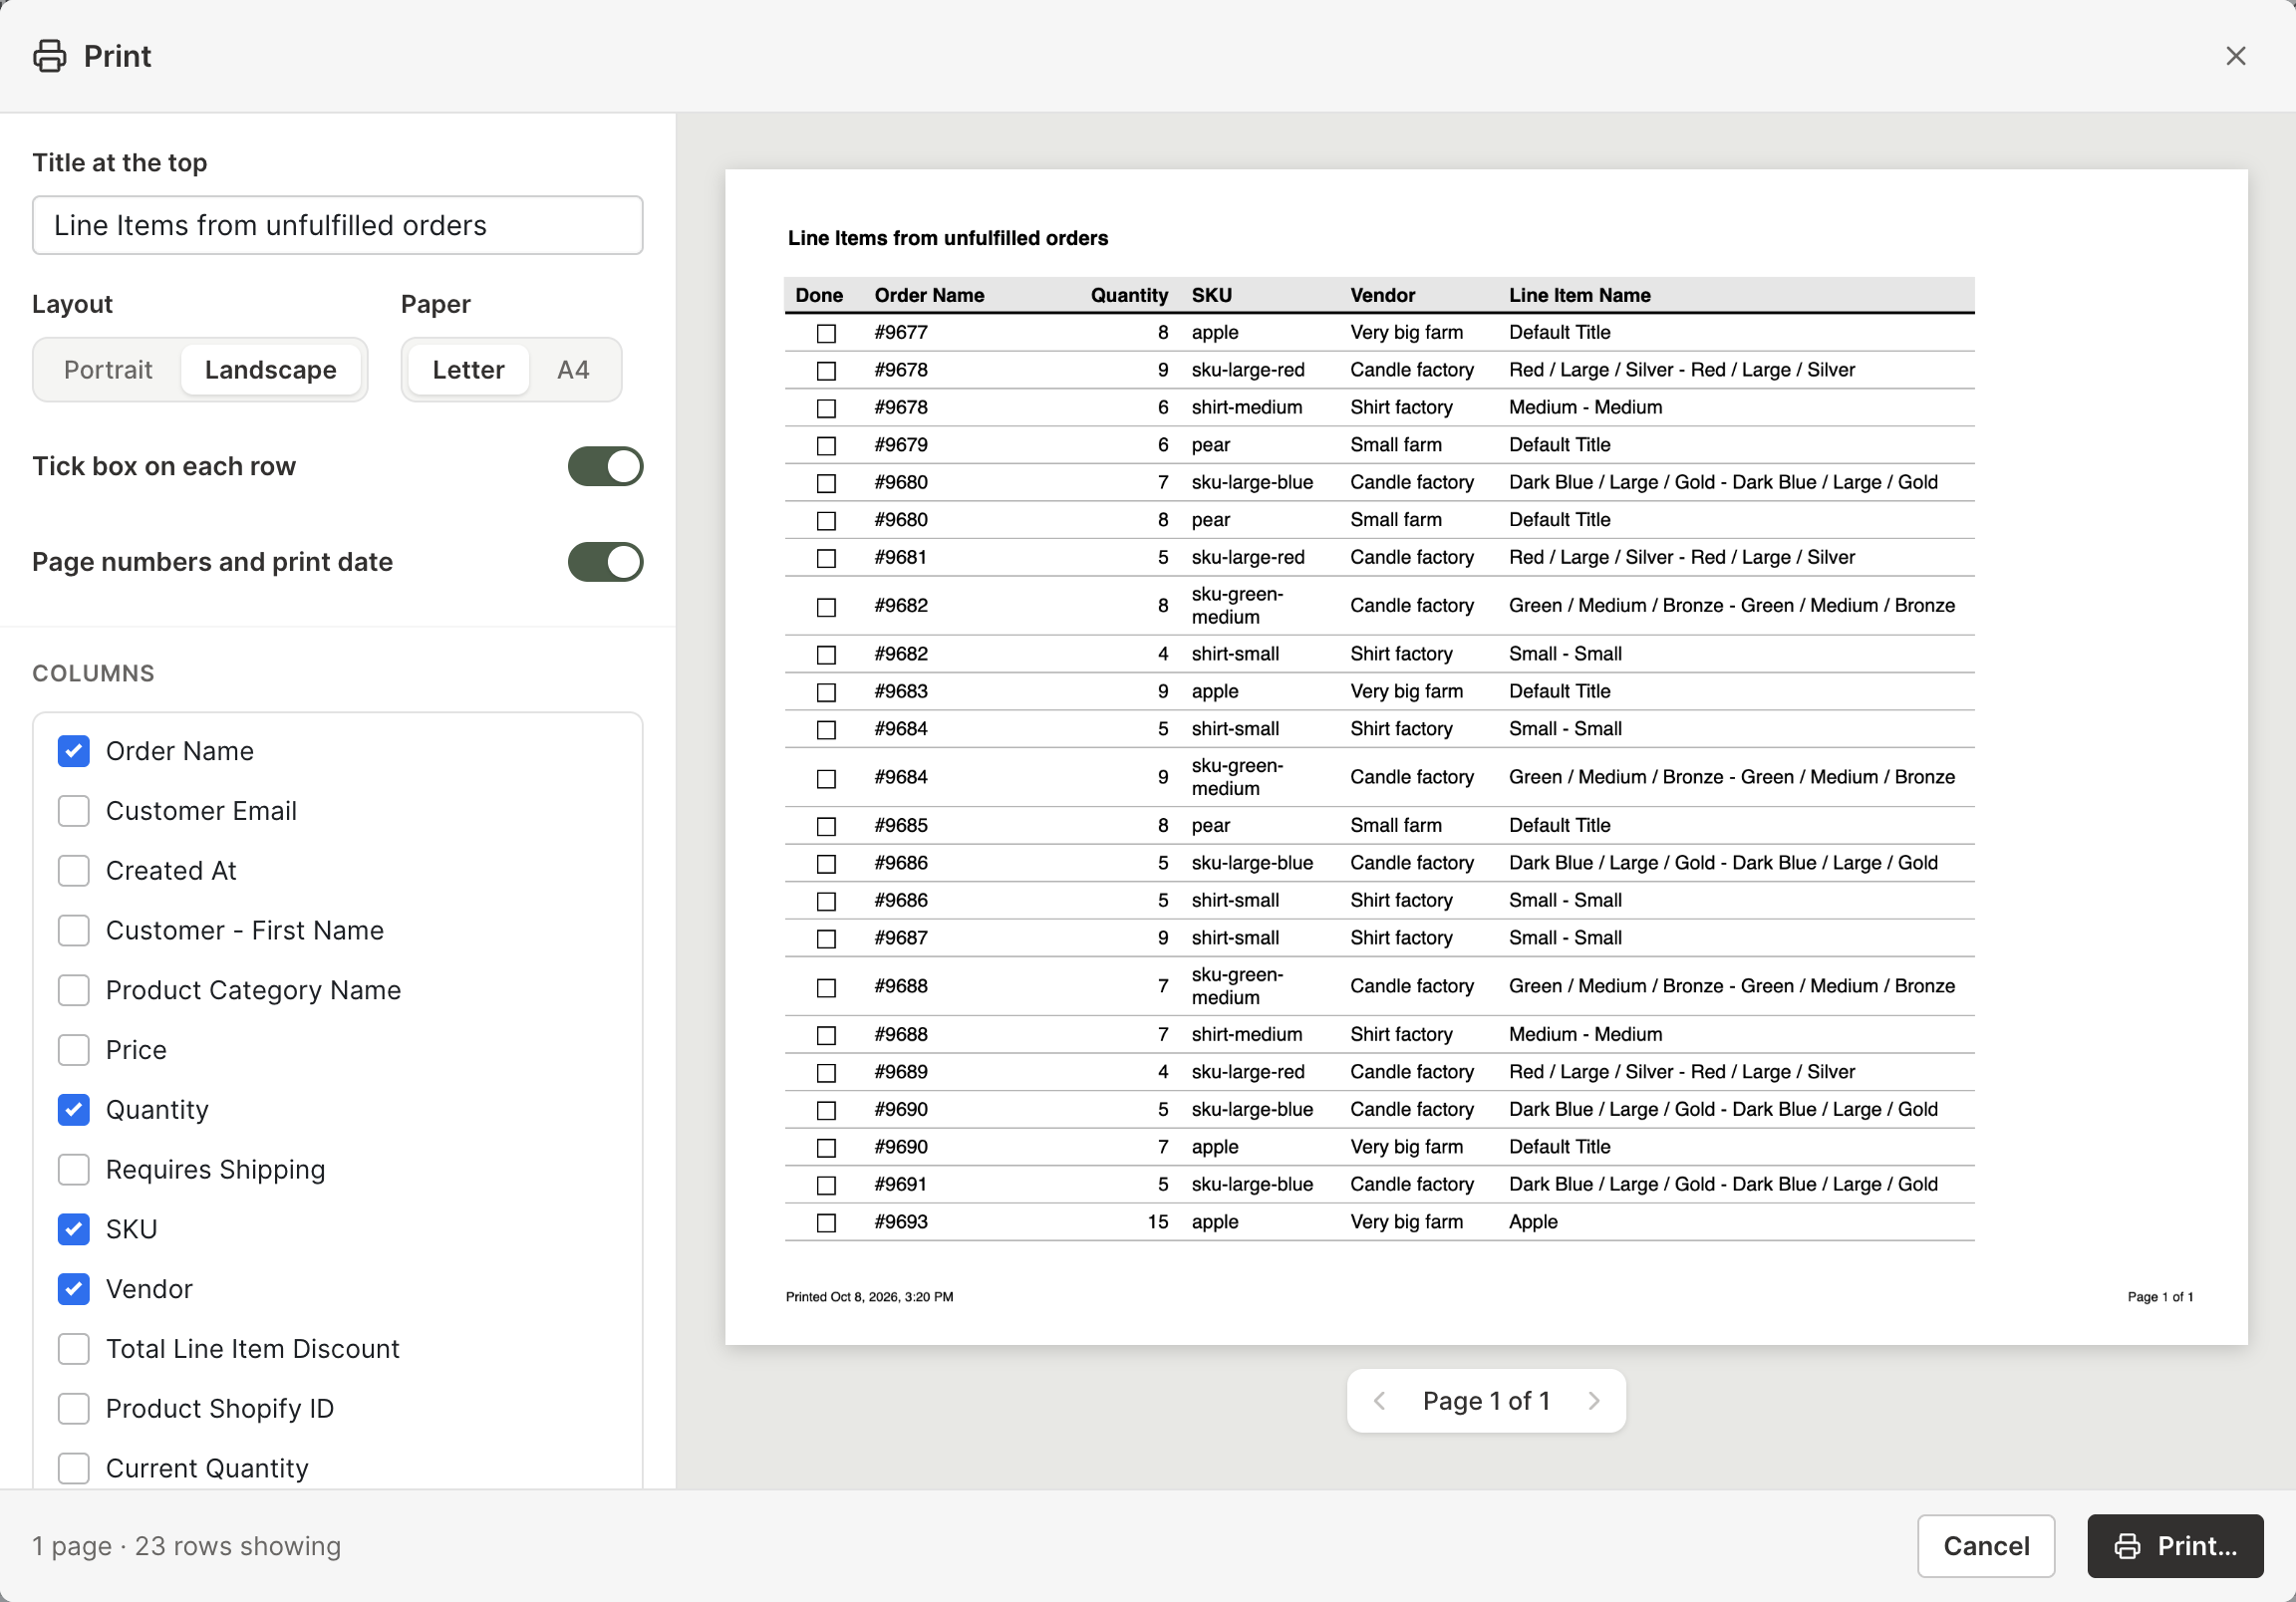
You can now print any worksheet, from a pick list of unfulfilled Shopify orders to a product list for a stock count. Choose File > Print…, or press ⌘P (Ctrl+P on Windows), and the Print window shows a live preview of the pages beside your settings: a title for the top of each page, portrait or landscape, Letter or A4 paper, page numbers and the print date, and which columns to include.
Mixtable prints the rows your worksheet is showing, in their current order, so filter or sort first to print just what you need. Values print the way they look in the cells, and column titles repeat at the top of every page. Turn on Tick box on each row to add a box for checking rows off by hand. On worksheets of orders or line items, such as the ones the Unfulfilled Orders template creates, Mixtable starts with just the columns a pick list needs ticked, ready for the warehouse.
Read more: Print Shopify orders, pick lists, and other worksheets
Time Series by day and by week
Time Series worksheets have two new kinds of columns, alongside By month (up to 36) and By year (up to 10):
- By day: one column per day, 30 by default and up to 90, ending yesterday
- By week: one column per week, Sunday to Saturday, 12 by default and up to 52, ending with last week
Days and weeks stop before today, so every column covers a finished period. They work with sales metrics and inventory metrics alike: follow your store’s net sales day by day, or watch a vendor’s closing stock week by week.
Read more: Create a Time Series worksheet for Shopify data
Translations for one market in your default language
If your store has two or more Shopify Markets, a Translations column can now change your default-language content for a single market, such as a “Product Title (English, Canada market)” column with a title just for shoppers in Canada. When you set up the column, your default language appears in the language list with “(default language)” after its name, and you then choose the market. URL handles aren’t included, since Shopify translates them by language only.
Translations columns for a specific market now also show Shopify’s current values after a download. Translations are labeled Beta in the app.
Read more: Bulk edit Shopify translations with a spreadsheet
See a row’s whole Shopify record in Details
Details, which used to be called the Sidebar, shows everything Mixtable has saved for the selected row’s Shopify record, including fields that aren’t columns in your worksheet. Click Details in the toolbar, or choose Row > Open in Details. For a product, that means its variants, collections, sales channels, metafields, and translations. For an order, it’s the items, fulfillments, refunds, and returns. Images and status badges show where they apply, and Details works with every type of Shopify data worksheet, from products and orders to B2B companies and payouts.
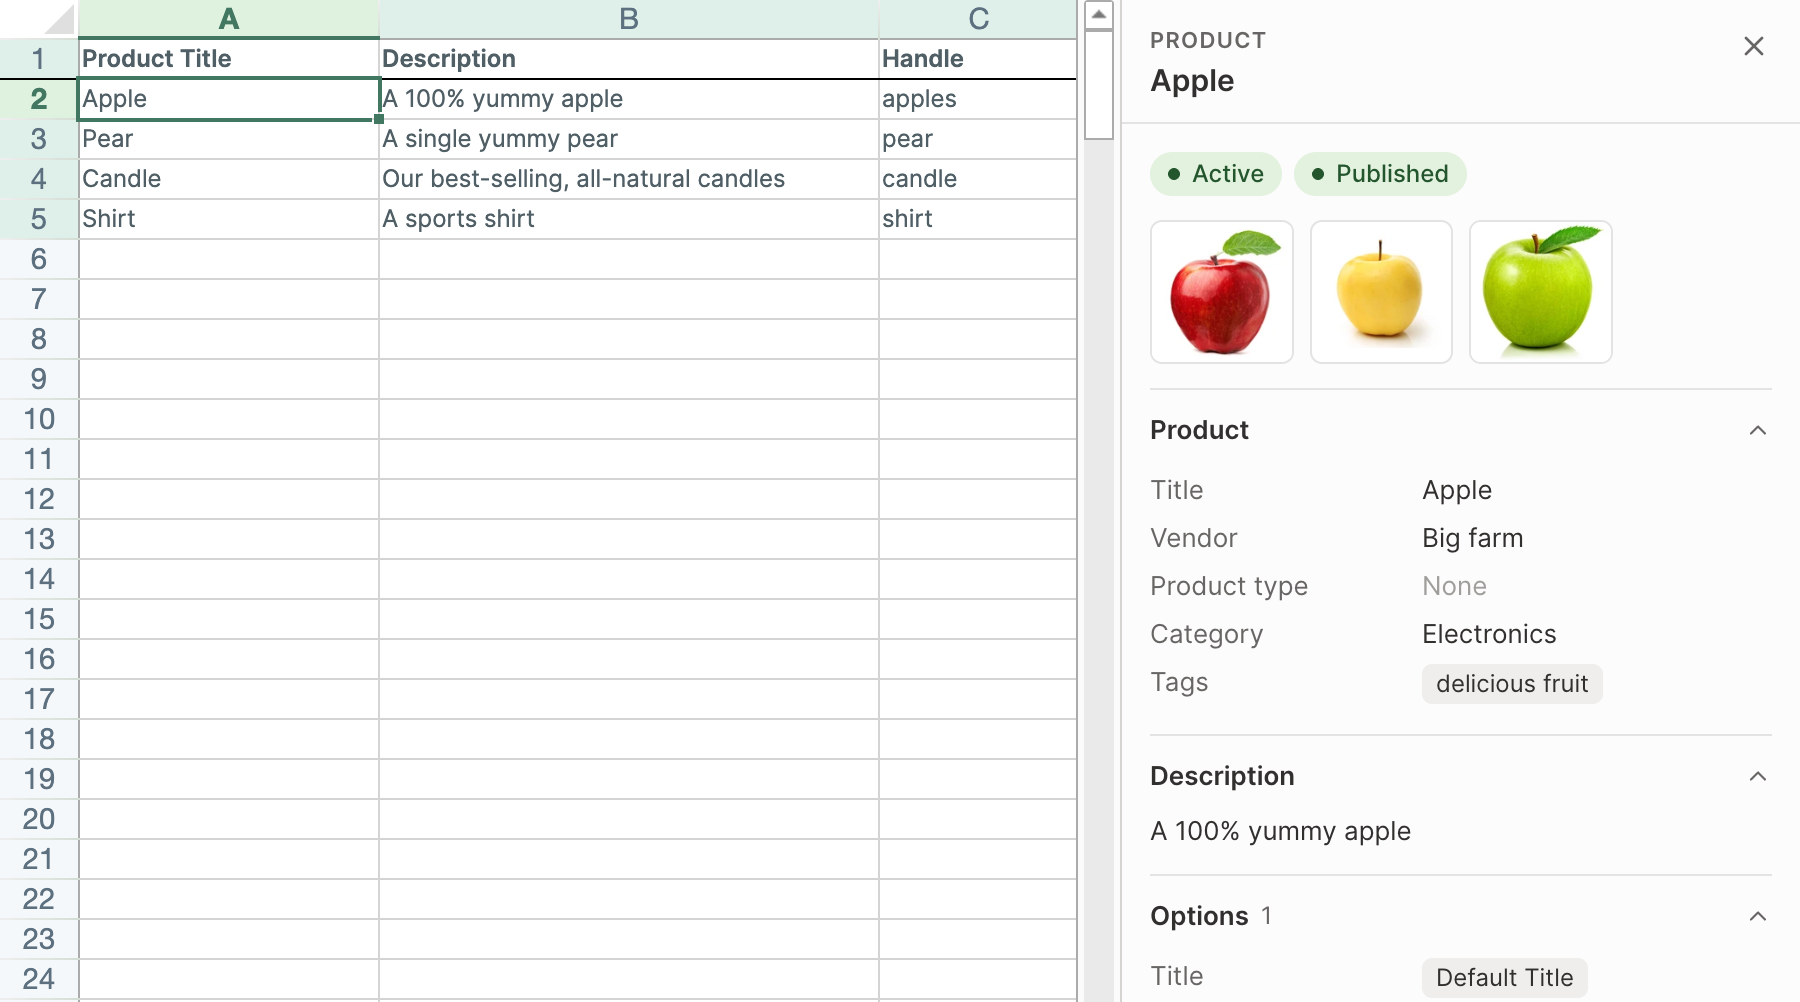
Unlike the Sidebar, Details is view only. To change a value, including a product description (which you edit as HTML), edit its cell in the worksheet, then sync as usual.
Read more: See a row’s Shopify record in the Details panel
A redesigned spreadsheet screen
The spreadsheet has a new menu bar, with menus named for what they act on: File, Worksheet, Column, Row, Bulk Edit, Shopify Sync, Import & Export, and Help. Below it, the toolbar has labeled Find, Sort, and Filter buttons, your formatting tools, and Details.
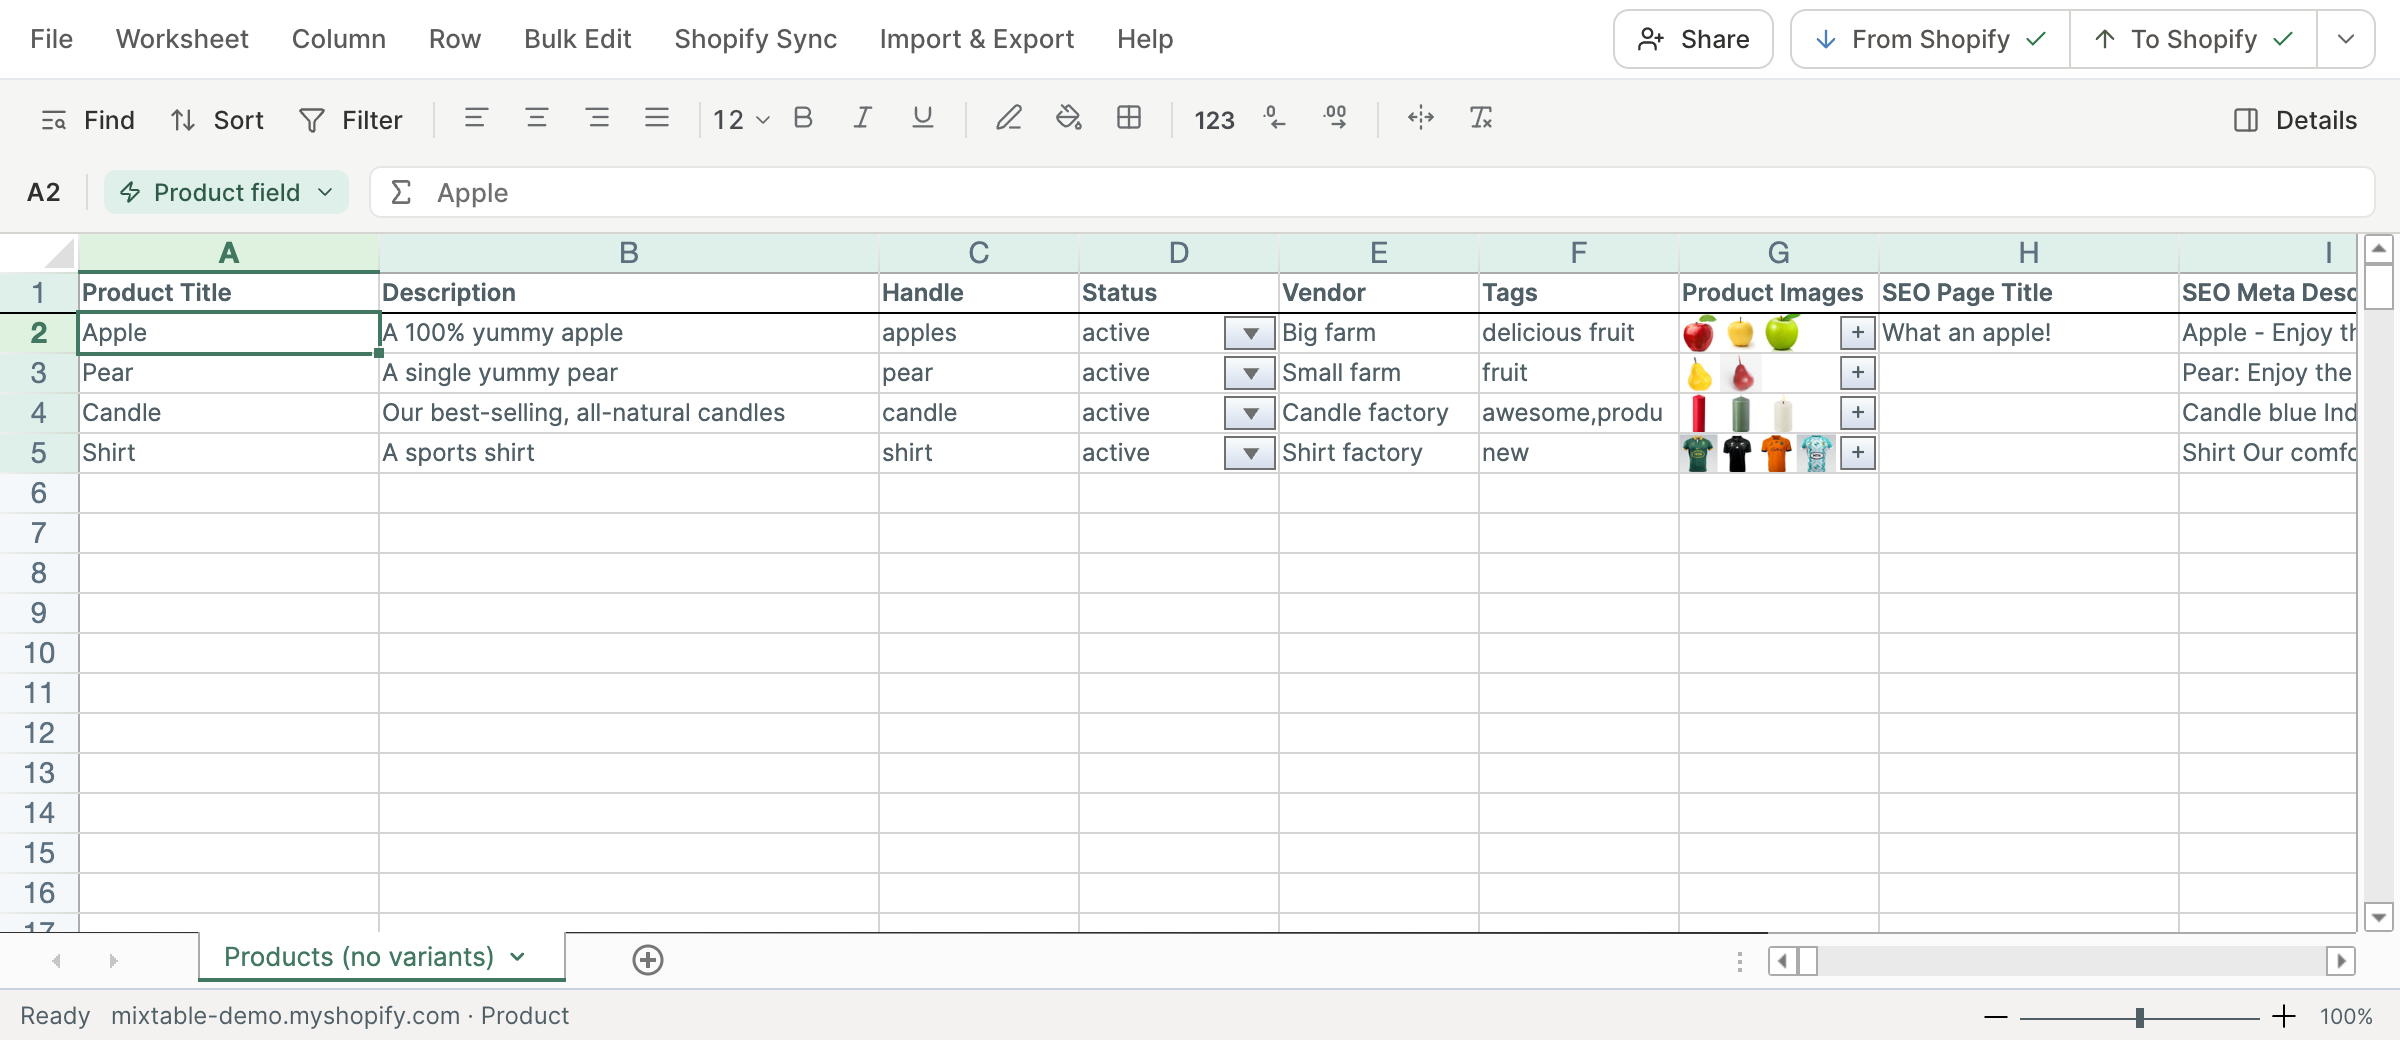
You can also open a menu right where you’re working. Right-click a column letter, a row number, or a worksheet tab to see what you can do with that column, row, or worksheet: insert a column, open a row’s history, rename the worksheet, and more. The current worksheet tab also has a small ▾ that opens its menu.
Adding Shopify data to a column is easier, too. Click + Shopify data in the header row of an empty column, or choose Column > Add Shopify data… from the menu bar. The field picker opens and asks What should column E show?, with your column’s letter in place of E. It lists every field the worksheet can show on one screen, grouped into sections the way your Shopify admin groups them, with a search box at the top and a sample value from one of your rows beside each field. Click a field to see what it holds, then click Save Column.
On Pivot Table and Time Series worksheets, the column button reads + Analytics data. To add a report row of your own, right-click an empty row’s number and click Choose what to analyze….
A few tools have new names:
- Bulk Tools is now Bulk Edit
- Format Column is now Type & format…
- Sync from Shopify is now Shopify Sync > Re-download store data…
Read more: Find your way around the Mixtable spreadsheet
Sync with Shopify from the top right
The sync card no longer floats at the bottom right of your screen. A sync control now sits at the top right of the spreadsheet, next to Share, and shows both directions at a glance:
- When you’ve made edits, it shows how many, for example Sync 12 changes, with Preview beside it. Click Preview to review your changes, then click Sync. Both cover the worksheet you have open
- When updates from Shopify are waiting while you work, it shows how many, for example Apply 3 updates. One click brings them in, or they come in on their own when you close the spreadsheet
- On worksheets with data that doesn’t update on its own, such as blog posts or market prices, it shows Download latest
- The ▾ at its end opens the full sync card, which you can also open with Shopify Sync > Sync with Shopify…
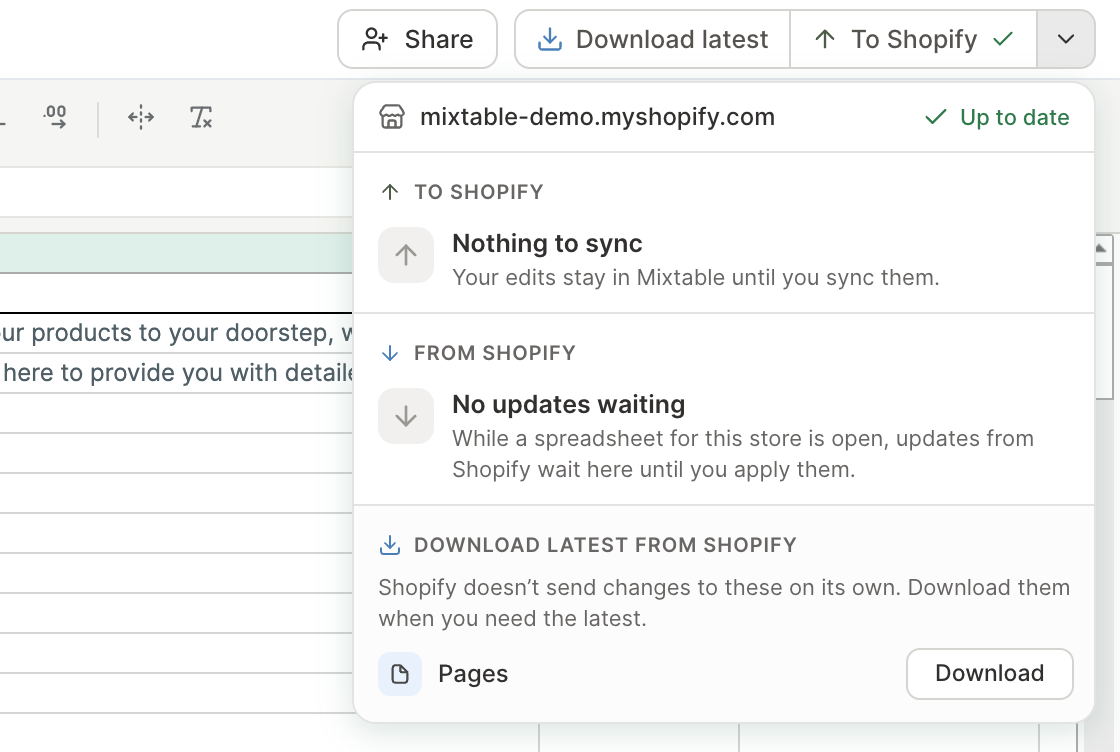
Sending edits to Shopify needs Mixtable Spreadsheet Editor with an active plan or trial. Without them, the control shows Install app to sync or Upgrade to sync instead.
Read more: Sync your spreadsheet with Shopify
