A Major Analytics Update: Pivot Tables, Time Series, and Ready-Made Shopify Reports
This is our biggest update to Mixtable Analytics yet. You now have far more ways to build focused Shopify reports, and the results still land in a familiar spreadsheet, right next to your Shopify data.
You can build two new kinds of analytics worksheets, start from a growing library of ready-made reports, and answer detailed questions about sales, discounts, fulfillment, returns, markets, and how customers find your store. Here is everything that is new.
Compare your store side by side with Pivot Table worksheets
The new Pivot Table worksheet is built for comparison. Break your results down by vendor, product type, collection, product category, product tag, Shopify Market, or customer segment, and Mixtable lays each group out on its own row with the metrics you care about in the columns.
It is the fastest way to answer the questions that never fit neatly into a product report: which vendors drive the most net sales, which collections get returned the most, which customer segments spend the most per order. And because it is a real worksheet, you can sort it, filter it, add formulas, and export it to Excel or CSV like any other spreadsheet.
Pivot Tables work with most of our metrics. See Shopify Net Sales Analytics or Shopify Collection Analytics for worked examples.
Track change over time with Time Series worksheets
The new Time Series worksheet shows how your store is doing over time. Choose your metrics (sales, orders, refunds, discounts, quantities sold, and more) and see each one broken out by month or by year.
This is the view for spotting trends and seasonality: comparing this year to last, watching refunds move month to month, or finding where a promotion pushed a spike in orders. As always, the numbers land in a normal worksheet you can format, add formulas to, and export.
Shopify Customer Segment Analytics walks through a Time Series report end to end.
Build any report in a few clicks
Not sure where to start? The new guided report builder walks you through it one step at a time: choose a report type, pick what to break your numbers down by, select your metrics, and set a timeframe. Mixtable then creates the worksheet for you, and you can adjust it afterward and add any filters supported by the selected metric.
If you would rather build from scratch, you still can. Start with a completely blank Pivot Table or Time Series worksheet and set everything up yourself.
Start fast with a library of ready-made reports
Every report is easier when you are not staring at a blank page. Mixtable now includes a growing library of ready-made reports you can open and use right away, then adjust to fit your store:
- Vendor sales leaderboard and Vendor net sales by year
- Market sales mix
- Category sales breakdown and Product tag scorecard
- Customer segment contribution and Customer segment net sales by month
- Store sales and orders by month
- Product type net sales by month
- Marketing channel net sales by month
- Order fulfillment & delivery speed
- Product sales & return rate
- Variant margin & inventory
- Customer lifetime value & orders
- Collection sales & refund rate
Pick the one closest to the question you have, then change the metrics, breakdown, timeframe, or supported filters whenever you need something different.
Add analytics columns to your live Shopify data worksheets
Analytics is not just for standalone reports anymore. You can now add analytics columns directly to a live Shopify data worksheet, so your editable Shopify data and your calculated performance metrics sit side by side in the same spreadsheet.
Picture a Products (with variants) worksheet where units sold and net sales for each variant sit beside its SKU, price, inventory, and product tags. That is the difference between knowing a variant is selling out and being able to do something about it in the same view. If you also use Mixtable Spreadsheet Editor, you can edit supported Shopify fields, review your pending changes, and sync them without leaving the spreadsheet.
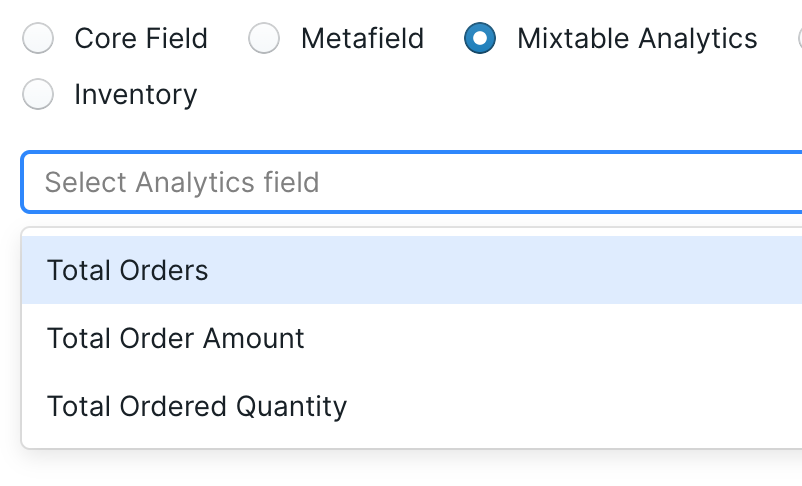
Shopify Product Variant Analytics covers this workflow in detail.
Deeper analytics for discounts, fulfillment, returns, and more
Alongside the core reporting tools, this release adds focused metrics and filters for the parts of a Shopify store that are usually hardest to measure. Add them to supported reports or Shopify data worksheets to answer more specific questions about your business.
Discount analytics
See how your promotions are really doing. Discount analytics measure the sales and redemptions tied to your Shopify discount campaigns, and you can filter a report by a searchable parent campaign instead of hunting through individual redeem codes. A campaign that generated hundreds of unique codes now reports as one thing, so you can see the full impact of a sale at a glance. See Shopify Total Discount Amount Analytics.
Fulfillment analytics
Understand how quickly and reliably orders get out the door. Measure fulfillment volume and fulfilled quantities, time to first fulfillment, and delivery speed. Depending on the metric, you can filter the calculation by fulfillment status, tracking company, fulfillment service, or location, which is how you find out whether a delay is your warehouse or your carrier.
Return analytics
Keep returns from becoming a blind spot. Track return requests, returned quantities, return rates, and return reasons, review open returns alongside refund totals, and see the average time it takes to close a return. It is the quickest way to spot problem products before they cost you more. See Percent of Orders Refunded and Total Refund Amount.
Shopify Markets analytics
If you sell internationally, compare your Shopify Markets side by side. See sales, refunds, discounts, average order value, and other results across the markets where orders were placed, so you can tell which regions deserve more of your attention. For single-country questions, see Filter Shopify Analytics by Customer Country.
Customer Journey attribution
See how customers found your store before they ordered. Customer Journey attribution lets you evaluate the first-touch and last-touch marketing sources, landing pages, referrers, and UTM values that Shopify provides. You can also measure how much of your order volume has attribution data at all, and how long shoppers take to convert.
Product Category analytics
Break performance down by Shopify’s standardized product taxonomy, the same category system Shopify uses across the platform. Products without a category are grouped into a clear Uncategorized row, so nothing quietly disappears from the report.
Break reports down by the Shopify dimensions that matter
Pivot Table worksheets can group results by vendor, product type, product tag, product category, collection, Shopify Market, or customer segment. Time Series worksheets can track store-wide metrics or group a metric by vendor, product type, Shopify Market, customer segment, or last-touch marketing channel.
Filters give you another way to narrow the calculation. Depending on the metric, supported filters include customer country, order type, fulfillment status, company, company location, discount campaign, Shopify Market, return status, return reason, and Customer Journey attribution values.
A bigger metric catalog
Reports are only as useful as the numbers behind them, so we expanded the list of metrics you can add across supported reports. You can now measure:
- Net sales, gross sales, and total sales
- Quantities sold and refunded quantities
- Order counts and refund counts
- Return rates
- Discounts, taxes, shipping, duties, and additional fees
- Average order value
- Profit and margins when cost-per-item data is available
- Refund totals, both including and excluding tax
Filter reports with clearer controls
Analytics metric filters let you narrow calculations using the Shopify criteria supported by each metric, such as customer segments, countries, discount campaigns, Markets, fulfillment details, return details, and Customer Journey attribution values.
When you define which Shopify objects belong in a custom reporting row, the condition builder now uses plain-language options such as Has a value and Has no value. For example, you can create a product reporting group for products that do not have a category yet.
Ready to try it
All of these features are available in Mixtable Analytics Spreadsheet. Open the app to start from a ready-made report, or build your own Pivot Table or Time Series worksheet from scratch. If you also use Mixtable Spreadsheet Editor, you can combine calculated analytics with editable Shopify data, then review and sync supported pending changes from the same spreadsheet.
Learn more about Mixtable Analytics