Shopify Analytics for the Last 30 Days in a Spreadsheet App
Shopify Analytics for the Last 30 Days in a Spreadsheet App
Sales data, such as revenue, quantity sold, refunds, and discounts, are key metrics for every online store, and tracking them ensures staying up-to-date with the store’s performance. Below, we will show you how you can have all this data in real-time in an online spreadsheet app, which gets updates from Shopify automatically.
Net sales / Gross sales dynamically for the last 30 days
Here is how you can pull Net sales / Gross sales data in a spreadsheet:
- After installing the Mixtable Analytics Spreadsheet app, click the Create Spreadsheet button.
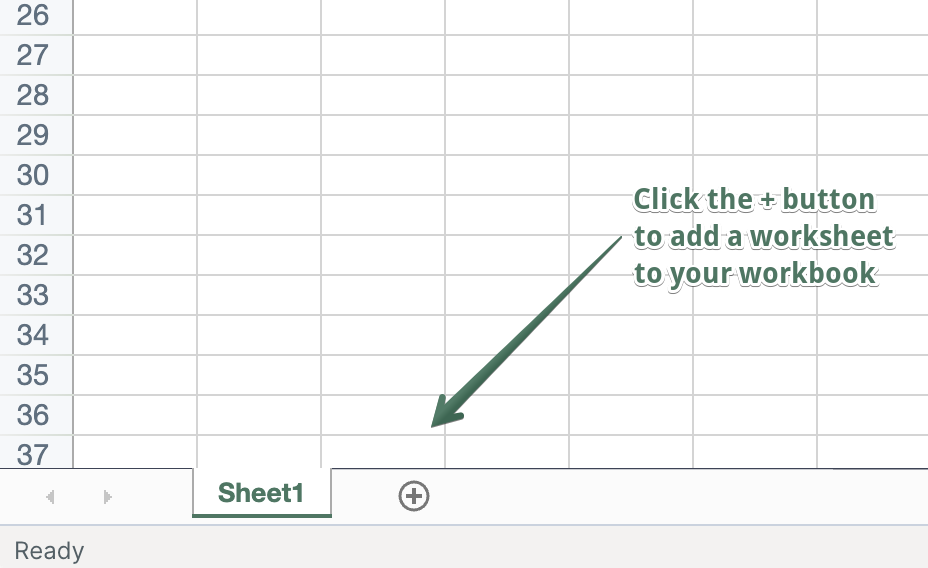
- In the Blank spreadsheet, click the (+) button at the bottom of the spreadsheet.
- Choose Shopify data worksheet > Products (with variants).
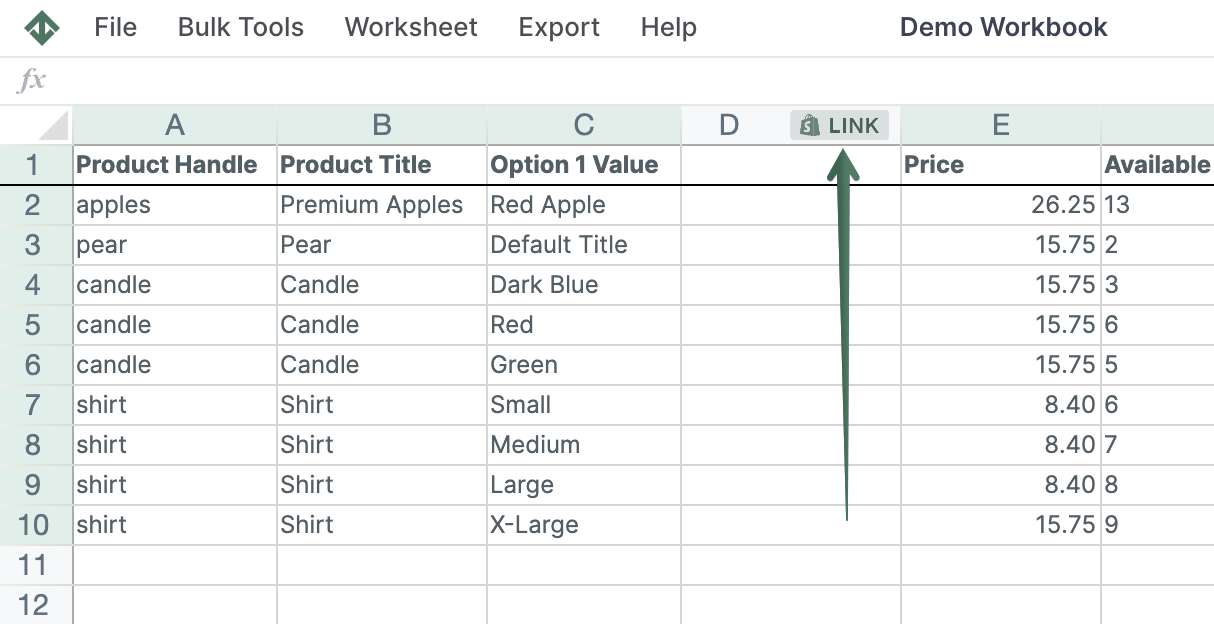
- To load new Shopify data, start by selecting an empty column — any column with a non-green header (green headers mean the column is already linked to Shopify data). Then, click the
 button in the column header to open the selection window to choose the data you want to pull in.
- Select Analytics > Net sales / Gross sales
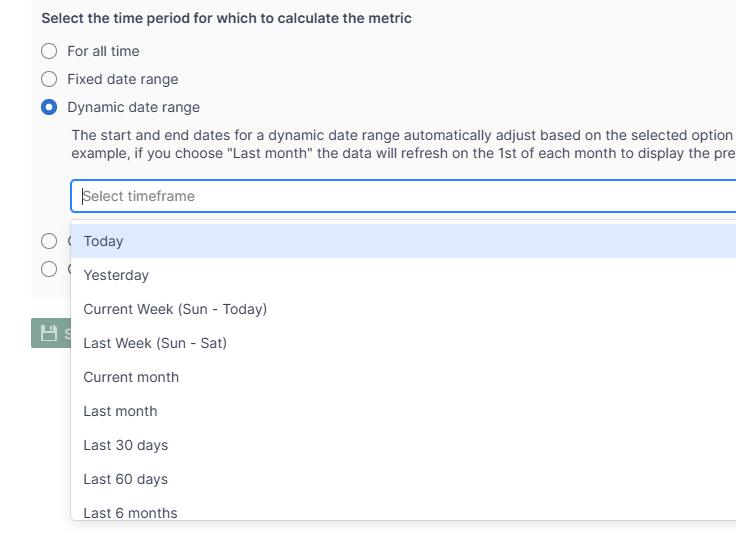
- From the Select the time period for which to calculate the metric, choose Dynamic Date Range > Last 30 Days.
Once you set up this column, it will be automatically updated with every new sale generated in your Shopify store—you won't need to run reports each time you want to see the latest data.
Net / Gross quantity sold dynamically for the last 30 days
Here is how you can pull Net / Gross quantity sold data in a spreadsheet:
- After installing the Mixtable Analytics Spreadsheet app, click the Create Spreadsheet button.
- In the Blank spreadsheet, click the (+) button at the bottom of the spreadsheet.
- Choose Shopify data worksheet > Products (with variants).
- To load new Shopify data, start by selecting an empty column — any column with a non-green header (green headers mean the column is already linked to Shopify data). Then, click the button in the column header to open the selection window to choose the data you want to pull in.
- Select Analytics > Net / Gross quantity sold
- From the Select the time period for which to calculate the metric, choose Dynamic Date Range > Last 30 Days.
Once you set up this column, it will be automatically updated with every new sale generated in your Shopify store—you won't need to run reports each time you want to see the latest data.
Order count analytics dynamically for the last 30 days
Here is how you can pull Order count analytics data in a spreadsheet:
- After installing the Mixtable Analytics Spreadsheet app, click the Create Spreadsheet button.
- In the Blank spreadsheet, click the (+) button at the bottom of the spreadsheet.
- Choose Shopify data worksheet > Products (with variants).
- To load new Shopify data, start by selecting an empty column — any column with a non-green header (green headers mean the column is already linked to Shopify data). Then, click the button in the column header to open the selection window to choose the data you want to pull in.
- Select Analytics > Order count analytics
- From the Select the time period for which to calculate the metric, choose Dynamic Date Range > Last 30 Days.
Once you set up this column, it will be automatically updated with every new sale generated in your Shopify store—you won't need to run reports each time you want to see the latest data.
Refunds analytics dynamically for the last 30 days
Here is how you can pull Refunds analytics data in a spreadsheet:
- After installing the Mixtable Analytics Spreadsheet app, click the Create Spreadsheet button.
- In the Blank spreadsheet, click the (+) button at the bottom of the spreadsheet.
- Choose Shopify data worksheet > Products (with variants).
- To load new Shopify data, start by selecting an empty column — any column with a non-green header (green headers mean the column is already linked to Shopify data). Then, click the button in the column header to open the selection window to choose the data you want to pull in.
- Select Analytics > Refunds analytics
- From the Select the time period for which to calculate the metric, choose Dynamic Date Range > Last 30 Days.
Once you set up this column, it will be automatically updated with every new sale generated in your Shopify store—you won't need to run reports each time you want to see the latest data.
Discounts analytics dynamically for the last 30 days
Here is how you can pull Discounts analytics data in a spreadsheet:
- After installing the Mixtable Analytics Spreadsheet app, click the Create Spreadsheet button.
- In the Blank spreadsheet, click the (+) button at the bottom of the spreadsheet.
- Choose Shopify data worksheet > Products (with variants).
- To load new Shopify data, start by selecting an empty column — any column with a non-green header (green headers mean the column is already linked to Shopify data). Then, click the button in the column header to open the selection window to choose the data you want to pull in.
- Select Analytics > Discounts analytics
- From the Select the time period for which to calculate the metric, choose Dynamic Date Range > Last 30 Days.
Once you set up this column, it will be automatically updated with every new sale generated in your Shopify store—you won't need to run reports each time you want to see the latest data.
You are ready!
Well done! Now that you have analytics data in an online spreadsheet, you can use any Excel function to analyze the data, such as:
- Sort ascending or descending,
- Find-replace,
- Filter,
- Use Excel formulas, e.g., for price changes, etc.
Find out more about the Mixtable suite of products here.
Manage Shopify data in a spreadsheet.
Use Mixtable to edit, sync, analyze, import, and export your Shopify store data without CSV juggling.