
Shopify Analytics for the Holiday Season
On this page
To help you prepare for the peak holiday season and get the most out of your Shopify store, we’ve outlined two key data categories to focus on: Products and Customers. We’ve also included actionable insights you can use based on these analytics:
Top Products vs. Worst Products:
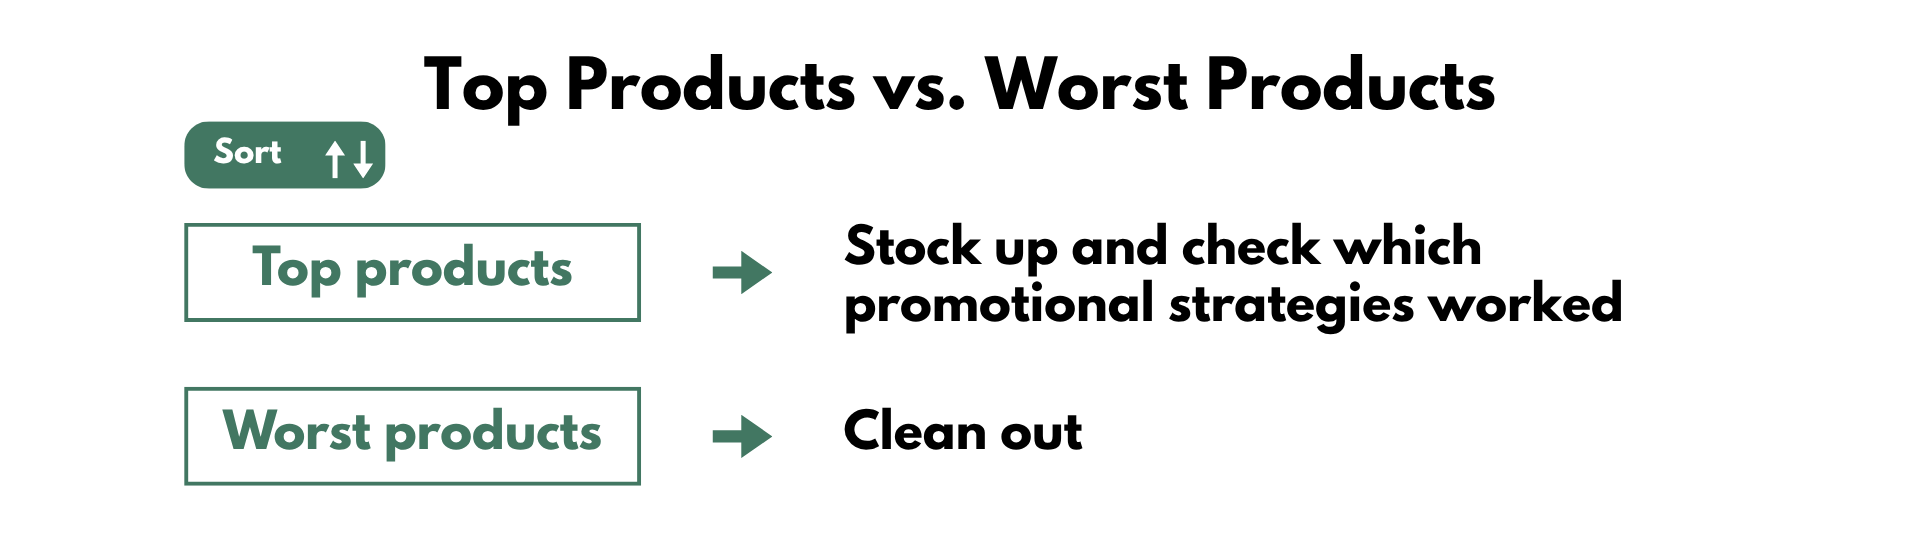
- Top-Selling Products: Identify your “hero” products from past holiday seasons. These are your money-makers and should be prioritized for promotions and inventory.
- Underperforming Products: Identify slow-moving or dead stock. Holiday sales can be a good time to offer deeper discounts to clear these out.
- Promotional Effectiveness: Which discounts, promotions, and campaigns performed best? What did customers respond to positively?
How to check Holiday season’s product performance?
Use the Mixtable Analytics spreadsheet app to analyze your products:
-
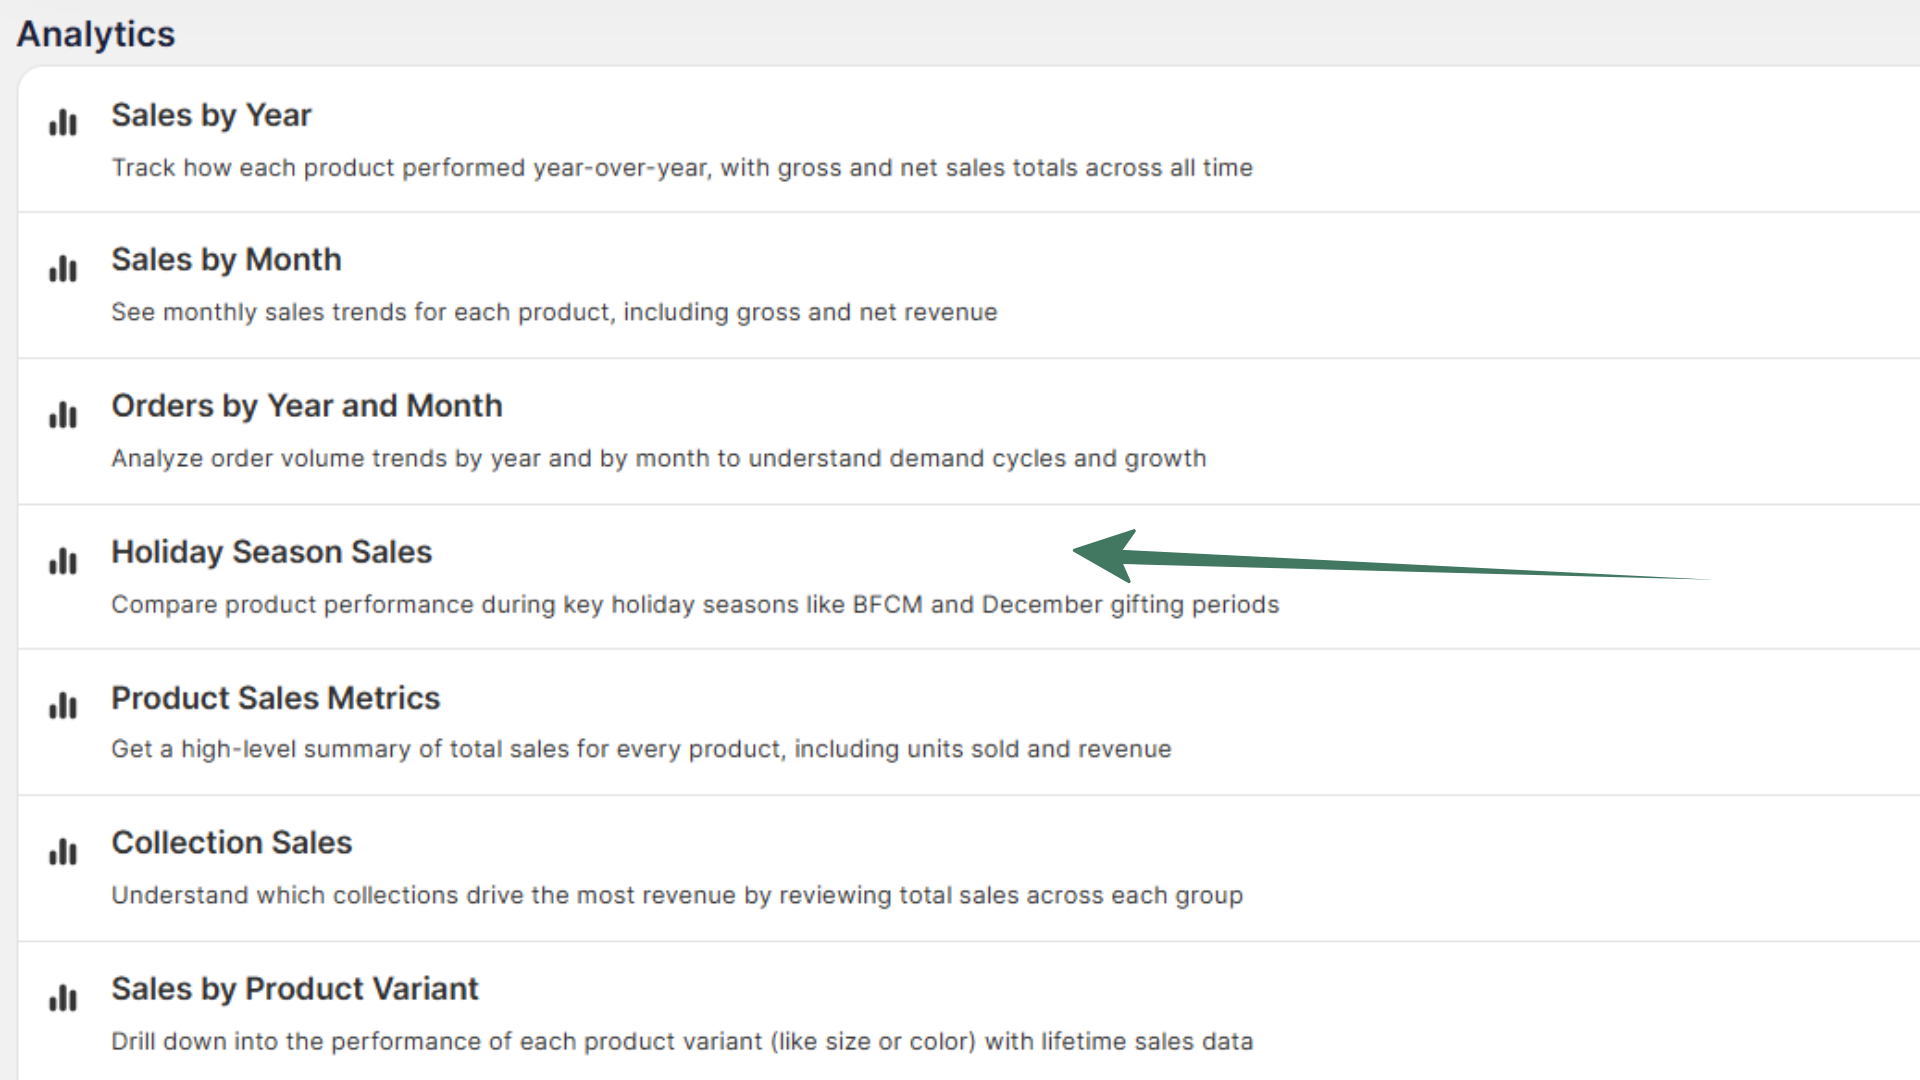
Start by loading data with the Holiday Season Sales template for high-level overview of the store performance for previous seasons. It is accessible via: Mixtable Analytics Spreadsheet > Create spreadsheet > Holiday Season Sales
-
Use the spreadsheet functions to sort products by sales volume and see the top performers on top and the worst performers at the bottom of the list.
-
Add more data to the spreadsheet to further analyze historic performance and craft your strategy.
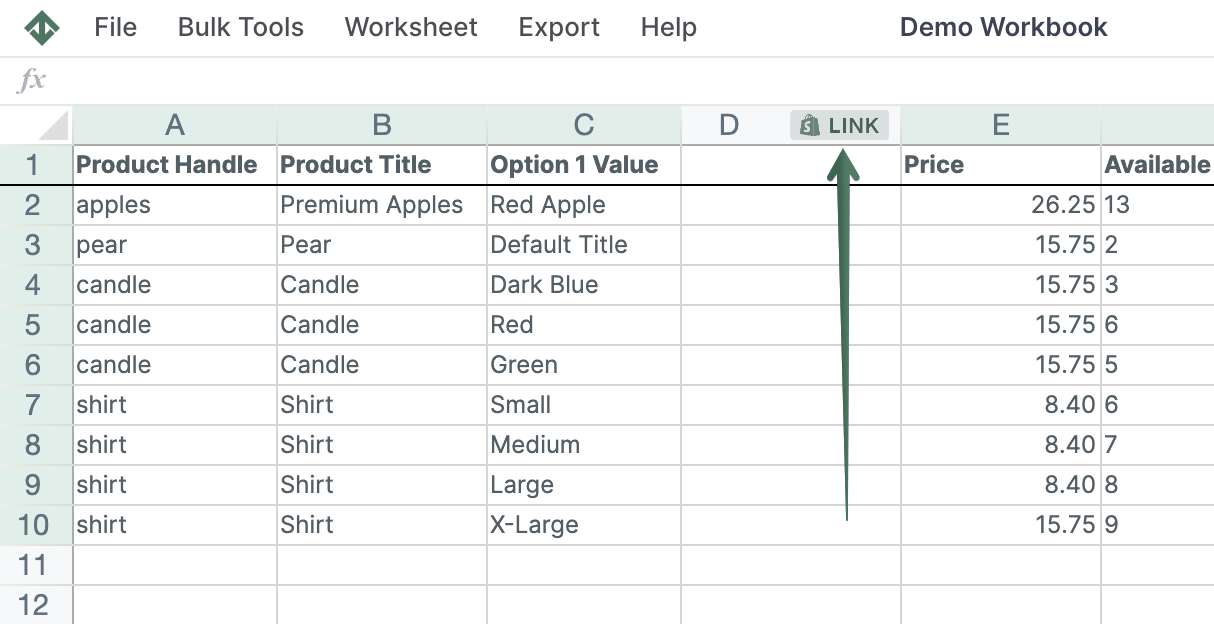
To load more Shopify data, click + Shopify data in the header row of an empty column, such as the one right after your last column. You can also choose Column > Add Shopify data… from the menu bar. The field picker opens and asks What should column E show?, with your column's letter in place of E. It lists everything the worksheet can show from Shopify, grouped into sections the way your Shopify admin groups them. Type in the search box at the top, or click a section on the left, to find the field you want.
-
You can add more analytics data, e.g., Net Quantity Sold or Total Discount Amount. In the field picker, click Sales & analytics in the list of sections on the left, then click the metric. Its settings open with that metric already chosen, so you can pick the holiday dates under Over what time period? and click Save Column
-
Use historical sales data, industry trends, and current market conditions to predict which products will sell best and how much inventory you’ll need.
-
Stock up on best-sellers and consider promotions for slow-moving items.
Holiday Shoppers Behavior
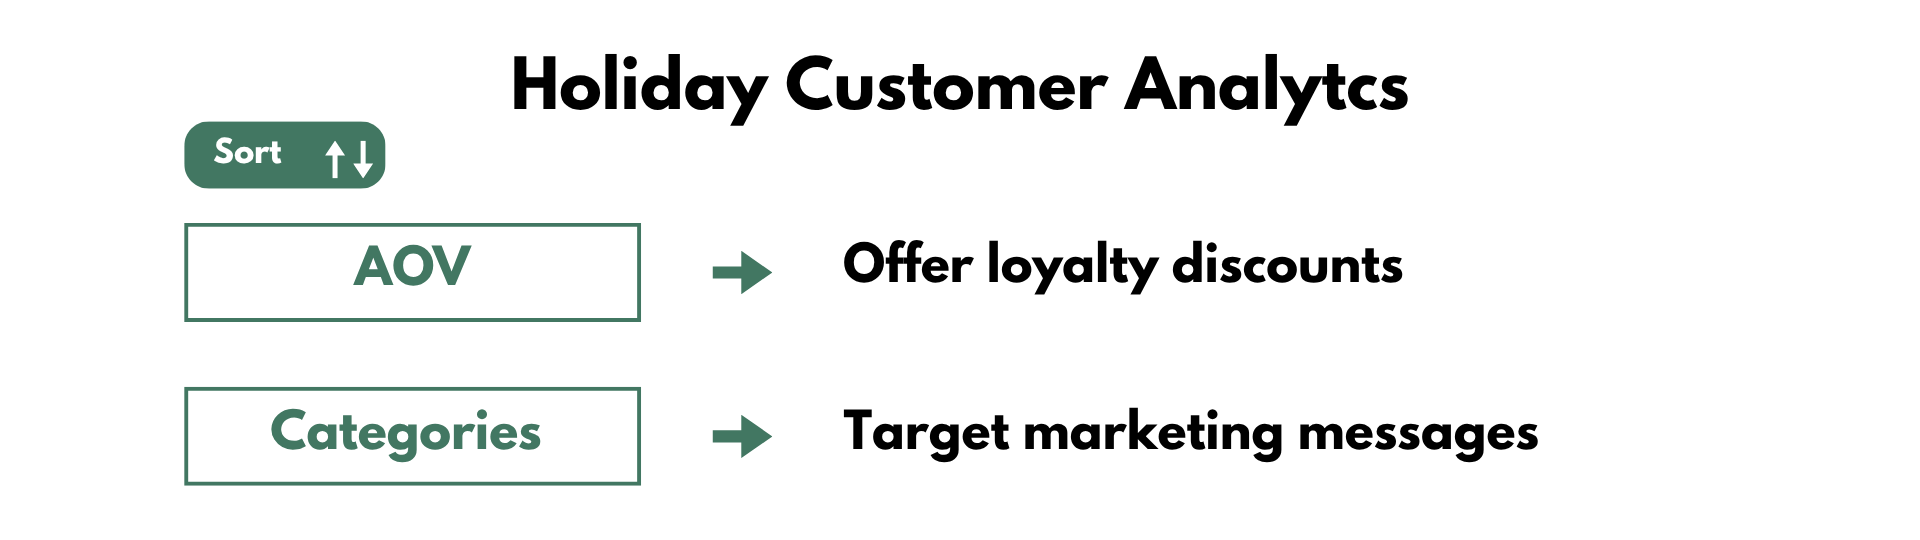
- Customer Demographics: Who are your holiday shoppers? (gender, location). This helps tailor marketing messages and product offerings.
- Amount Spent During Holidays: Segment users based on amount spent and send them loyalty program discounts to increase their AOV.
- Product Categories Bought: Identify any patterns about their purchase behavior can help you craft better campaigns for the coming season.
How to see customer behavior during past holiday seasons?
Use the Mixtable Analytics spreadsheet app to analyze your customer behavior:
-
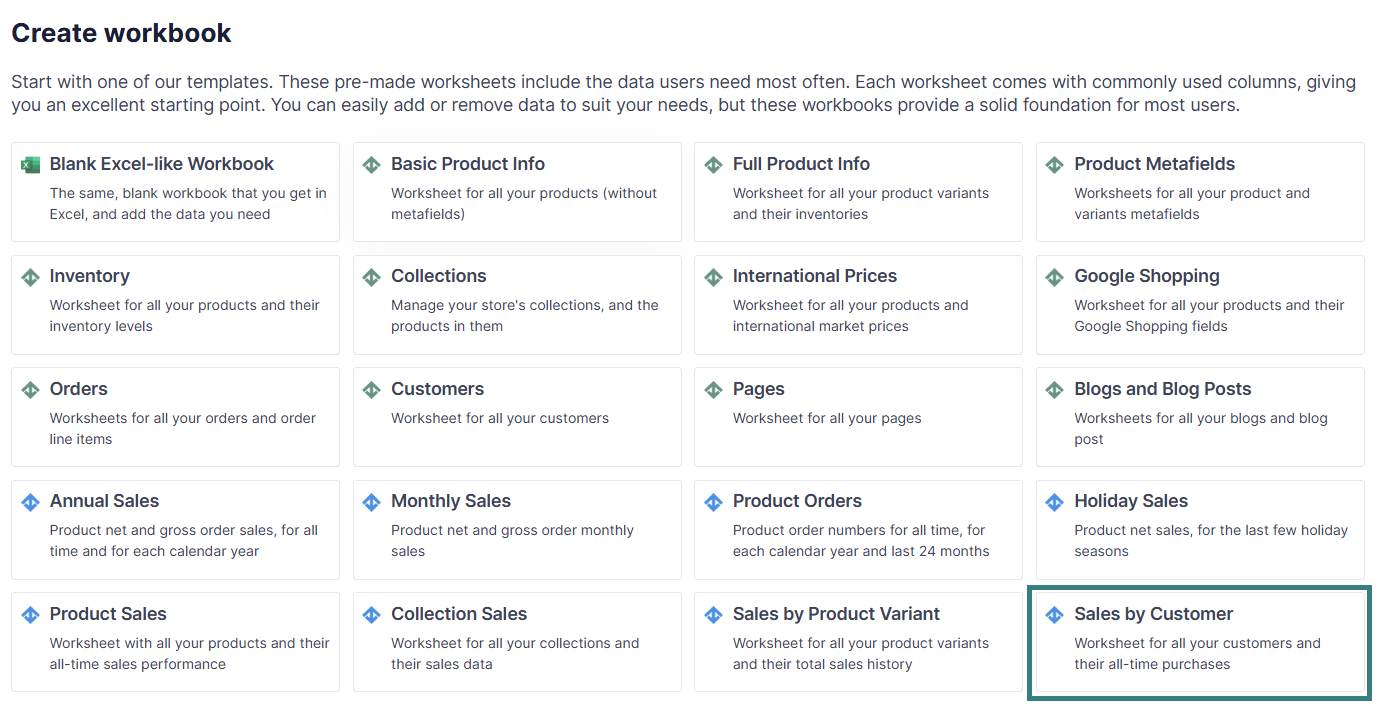
Start by loading data with the Sales by Customer template for detail overview of the store performance for all orders. It is accessible via: Mixtable Analytics Spreadsheet > Create spreadsheet > Sales by Customer
-
Now, in the same Sales by Customer worksheet, load customer data for past years’ holiday season to get an understanding of your users’ sales behaviour during peak periods. Here’s how:
To load more Shopify data, click + Shopify data in the header row of an empty column, such as the one right after your last column. You can also choose Column > Add Shopify data… from the menu bar. The field picker opens and asks What should column E show?, with your column's letter in place of E. It lists everything the worksheet can show from Shopify, grouped into sections the way your Shopify admin groups them. Type in the search box at the top, or click a section on the left, to find the field you want.
-
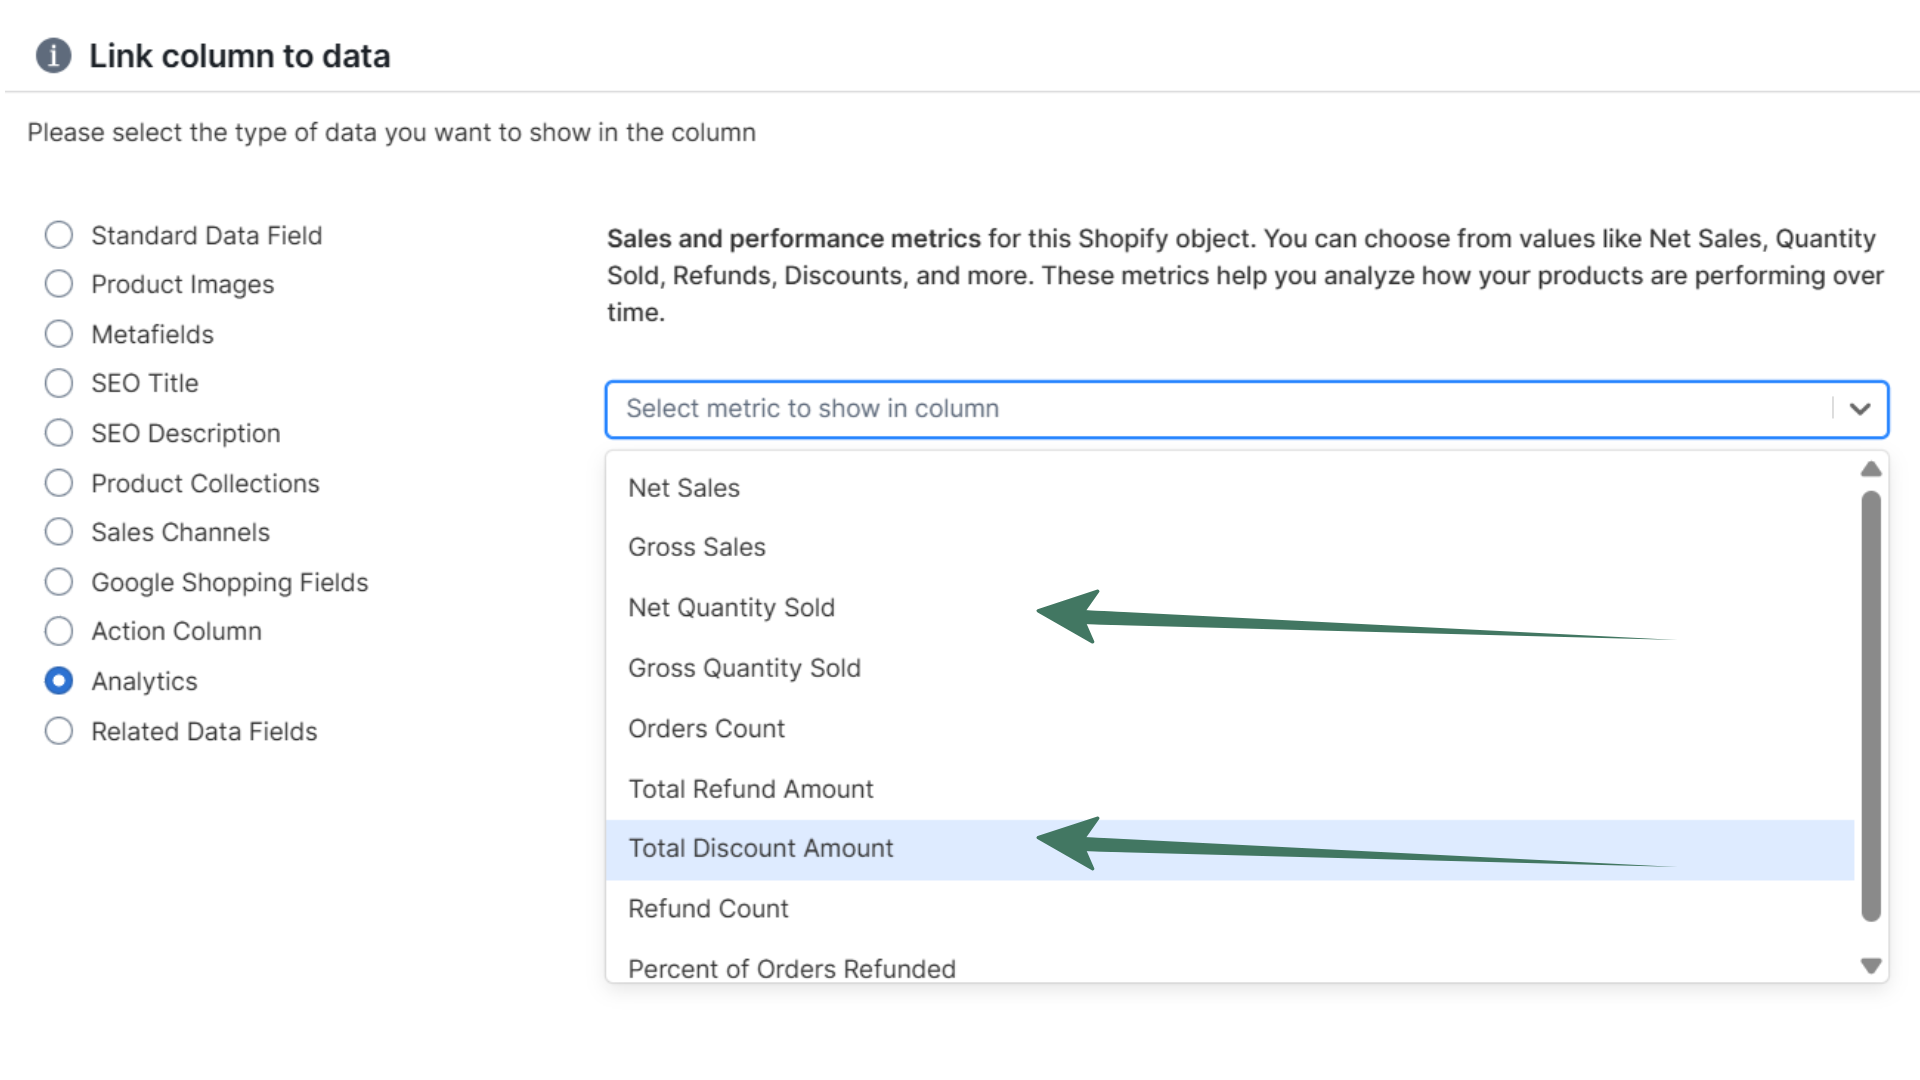
Then, click Sales & analytics in the list of sections on the left, and click a metric, such as:
- Order Count
- Gross Sales
- Total Discount Amount
- Average Order Value
-
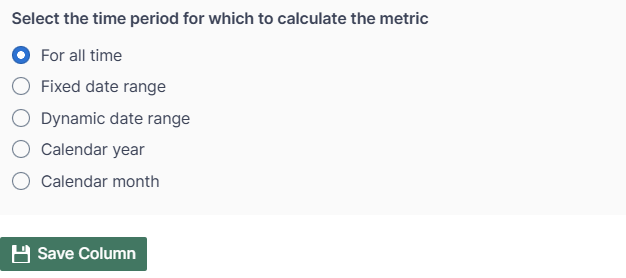
The metric’s settings open with it already chosen. Under Over what time period?, choose Fixed dates and pick a past holiday season, e.g., September 1 to December 31 of last year. Then click Save Column
-
Use the spreadsheet functions to sort products by sales metrics and analyze their performance during the holidays.
By thoroughly analyzing this data, you can make informed decisions to optimize operations, enhance marketing strategies, and improve the customer experience for a successful holiday sales season - plan out your holiday sales in advance with Mixtable spreadsheets.
