
Shopify inventory management and tracking
 Spreadsheet EditorAnalytics Spreadsheet Updated October 8, 2026
 On this page
- How Shopify stores inventory
- Manage Shopify inventory in a spreadsheet with Mixtable
- Start from the Inventory template
- Add inventory columns to any product worksheet
- Set inventory quantities and sync them to Shopify
- Change many cells at once
- Adjust inventory up or down instead of setting it
- Manage inventory across multiple locations
- Use formulas to work out the numbers for you
- Turn on inventory tracking for many products at once
- Decide what happens when stock runs out
- Import inventory from a CSV
- Sync inventory from an external system
- Narrow the sheet to the products you care about
- Changes in Shopify flow back into the sheet
- Preview every change before it reaches Shopify
- Share and export your inventory
- Everything you can do with inventory in Mixtable
- Report on inventory: cost, value, and sell-through
- Shopify inventory history
- How to manage inventory in the Shopify admin
- Why Shopify inventory management matters
- Shopify inventory management best practices
- Frequently asked questions
 Shopify inventory management and trackingVideo walkthrough
 Inventory is the part of a Shopify store that punishes you fastest when it goes wrong. Stock out of a best seller and you lose the sale. Overbuy and you tie up cash in boxes that sit in a warehouse. Let the numbers drift out of date and you oversell, then spend the week apologizing.
The tooling is usually the problem. The Shopify admin edits inventory one product at a time, which is fine for ten SKUs and painful for a thousand. Most merchants end up exporting a CSV, fixing it in Excel, and importing it back, which is slow and easy to get wrong.
This guide covers both approaches. It starts with how Shopify actually stores inventory, then goes deep on managing it in a spreadsheet with Mixtable, shows how to look back through your inventory history, then covers the same jobs in the Shopify admin so you can see the difference, and closes with why inventory management matters and the practices worth adopting.
What this guide covers
- How Shopify stores inventory
- Managing inventory in a spreadsheet with Mixtable
- Reporting on inventory cost, value, and sell-through
- Shopify inventory history: stock levels over time
- How to manage inventory in the Shopify admin
- Why inventory management matters
- Inventory management best practices
How Shopify stores inventory
Three things are worth understanding before you change anything, because they explain the shape of every tool in this guide.
Inventory belongs to variants, not products. This is true even when a product looks like it has no variants, because Shopify always creates one behind the scenes. A t-shirt in three sizes and two colors has six variants and six independent stock numbers. Any tool that claims to set “the inventory of a product” is really setting the inventory of its variants.
Inventory is tracked per location. If you have a warehouse, a retail shop, and a third-party fulfillment center, each variant has a separate quantity at each one. Shopify decides what is sellable by adding up the locations that serve your online store.
Each variant and location pair has several quantity states, not one number. Shopify splits stock into states so you can tell the difference between goods you can sell and goods that are spoken for.
| Quantity state | What it means | Can Mixtable write it back to Shopify? |
|---|---|---|
| Available | Stock you can still sell | Yes |
| On hand | Everything physically at the location, including committed stock | Yes |
| Committed | Attached to orders that are placed but not yet fulfilled | Read only |
| Incoming | On its way to the location | Read only |
| Reserved | Held back from sale | Read only |
| Damaged | At the location but not sellable | Read only |
| Safety stock | Held as a buffer | Read only |
| Quantity control | Held for quality control | Read only |
The read only states still matter, because you can pull them into a spreadsheet alongside the ones you edit. Seeing Committed next to Available is what tells you whether a low number is a real problem or just a busy morning.
Note: Shopify only holds quantities for variants that have inventory tracking turned on. If tracking is off, the variant sells indefinitely and has no stock number at all. Turning tracking on in bulk is covered below.
Manage Shopify inventory in a spreadsheet with Mixtable
Mixtable puts your Shopify store into a spreadsheet that stays connected to it. Stock levels arrive as columns, you edit them the way you would edit any spreadsheet, and nothing reaches Shopify until you click Sync.
That connection is the important part. This is not an export you fix up and re-import. The numbers in the sheet are the numbers in your store, and changes made in Shopify flow back into the sheet automatically.
Start from the Inventory template
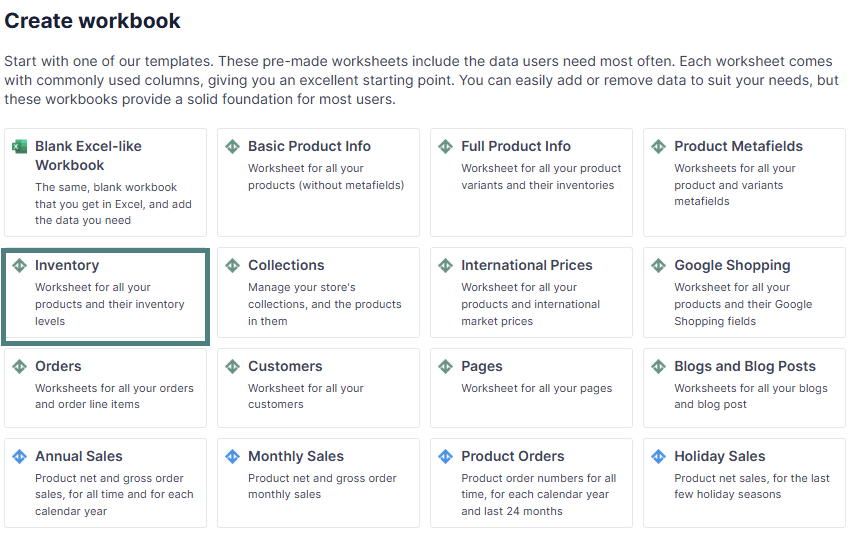
The fastest way in is the prebuilt template in Mixtable Spreadsheet Editor.
Open your Mixtable dashboard and click Create spreadsheet at the top of the page. If you haven't created a spreadsheet yet, click Browse all templates below the starting-point cards instead. In the Create spreadsheet window, find Inventory under Inventory & Pricing, or type its name in the search box, and click it. Mixtable creates the spreadsheet and fills it with data from your Shopify store.
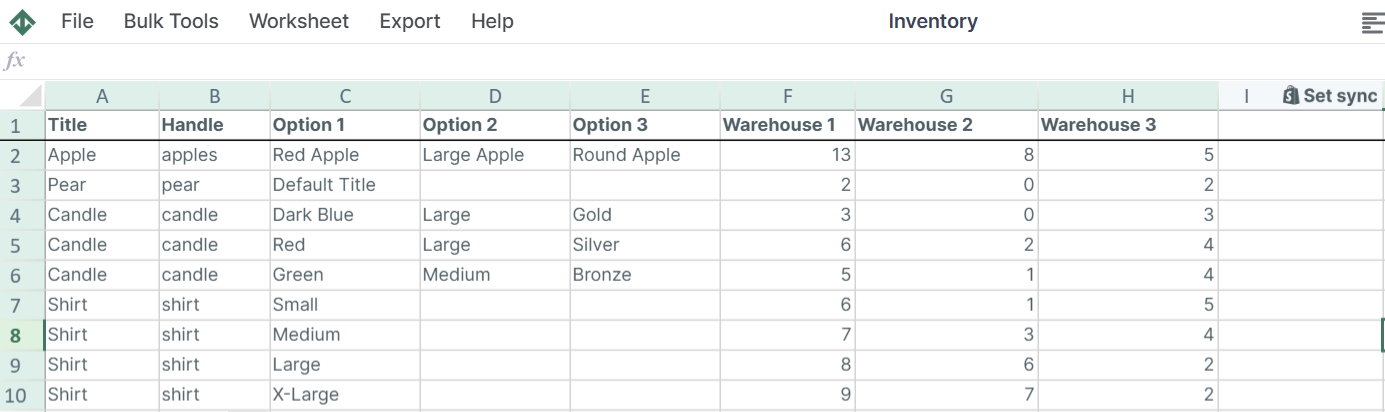
Mixtable builds a worksheet with one row per variant, containing the product title, handle, and up to three variant options, then adds an Available stock column for every location in your store, headed with the location’s name (for example Main Warehouse / Available). If you have four locations, you get four editable stock columns side by side.
For a fuller walkthrough of the template and the decisions it supports, see the Inventory template article.
Add inventory columns to any product worksheet
If you already have a worksheet you like, you can map inventory into a spare column instead of starting over. This works on any Products (with variants) worksheet, where each row is a variant, such as the one the Full Product Info template creates.
- Click + Shopify data in the header row of an empty column, or choose Column > Add Shopify data… from the menu bar. The field picker opens and asks What should column E show?, with your column’s letter in place of E
- Click Inventory in the list of sections on the left, or type stock in the search box
- Under By location, click Stock at followed by the location you want, such as Stock at Headquarters. If you added a location in Shopify recently, click Refresh in the Inventory heading to pull it in
- In the panel on the right, choose which count to show, for example Available or On hand. Click Show 4 more counts for the others, such as Damaged or Safety stock
- Click Save Column
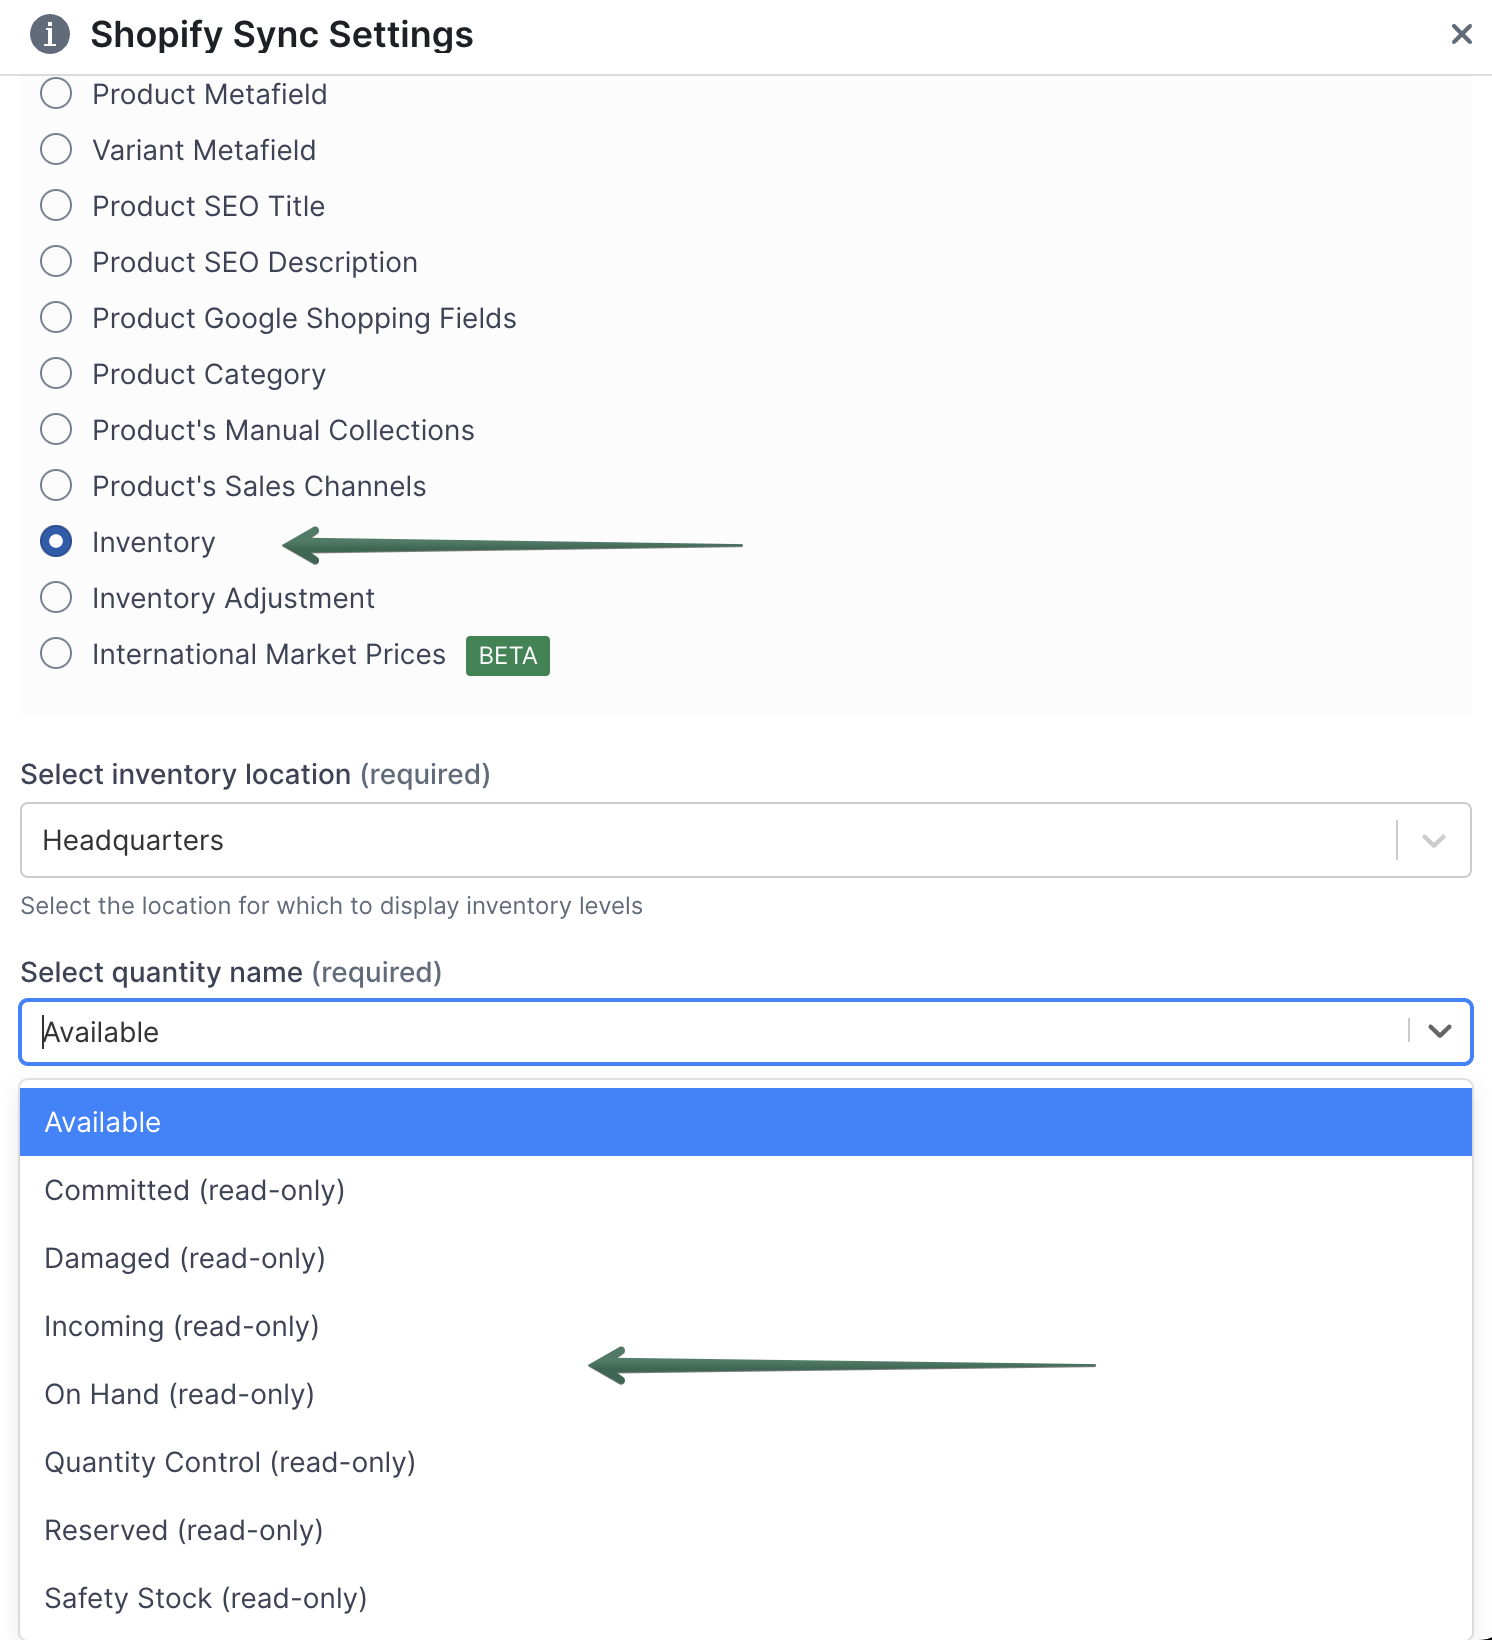
To put the column in a particular spot, insert an empty column there first: right-click the letter of the column it should go before and choose Insert column to the left. The new column gets its own + Shopify data button to click in the first step. And when you add a new Products (with variants) worksheet, the Choose your columns step already offers an Available inventory @ column for each of your locations.
The column fills with each variant’s stock at that location, headed with the location and the count, such as Headquarters / Available. Repeat for every location and quantity combination you want visible. There is no limit, so a sheet showing Available and Committed at three locations is six columns and perfectly normal.
Set inventory quantities and sync them to Shopify
Once the columns exist, changing stock is ordinary spreadsheet work.
- Find the cell for the variant and location you want to change, and type the new number
- The cell turns light yellow, which means the change is saved in Mixtable but has not gone to Shopify yet
- When you are happy with everything you have changed, click Preview at the top right of the spreadsheet to review your changes, then click Sync
The yellow highlight is deliberate. You can edit fifty cells across three locations, walk away, come back, check your work, and only then push. Nothing is sent to your store until you ask for it.
Change many cells at once
Typing into cells one at a time is the slowest option available to you, and often not the right one. Everything a spreadsheet gives you for editing numbers in bulk works on inventory columns.
-
Bulk number changes applies one operation to every visible row of the column you choose: Add, Subtract, Increase by %, Decrease by %, Multiply, or Divide. Open it from Bulk Edit > Bulk number changes in the menu bar, or right-click a stock column’s letter and choose Bulk number changes… to open it with that column already chosen. To change only some rows, filter the worksheet first. Keep Preview first 10 rows on to see the result before committing, and turn on Round results to keep whole units
-
Copy and paste moves a block of numbers between locations, or brings a column in from a supplier’s spreadsheet
-
Click and drag fills the same value down a column, which is how you set every variant of a discontinued line to zero in one gesture
Adjust inventory up or down instead of setting it
Setting inventory to an absolute number has a race condition built into it. If a customer buys two units in the moment between you reading the sheet and clicking sync, your “correct” number is now wrong by two.
Adjustment columns solve this. Instead of stating what the total should be, you state the change, and Shopify applies it to whatever the current value is.
To set one up on a Products (with variants) worksheet, click + Shopify data in the header row of an empty column, click Inventory in the field picker’s list of sections, click Add or remove stock at followed by a location’s name, and click Save Column.
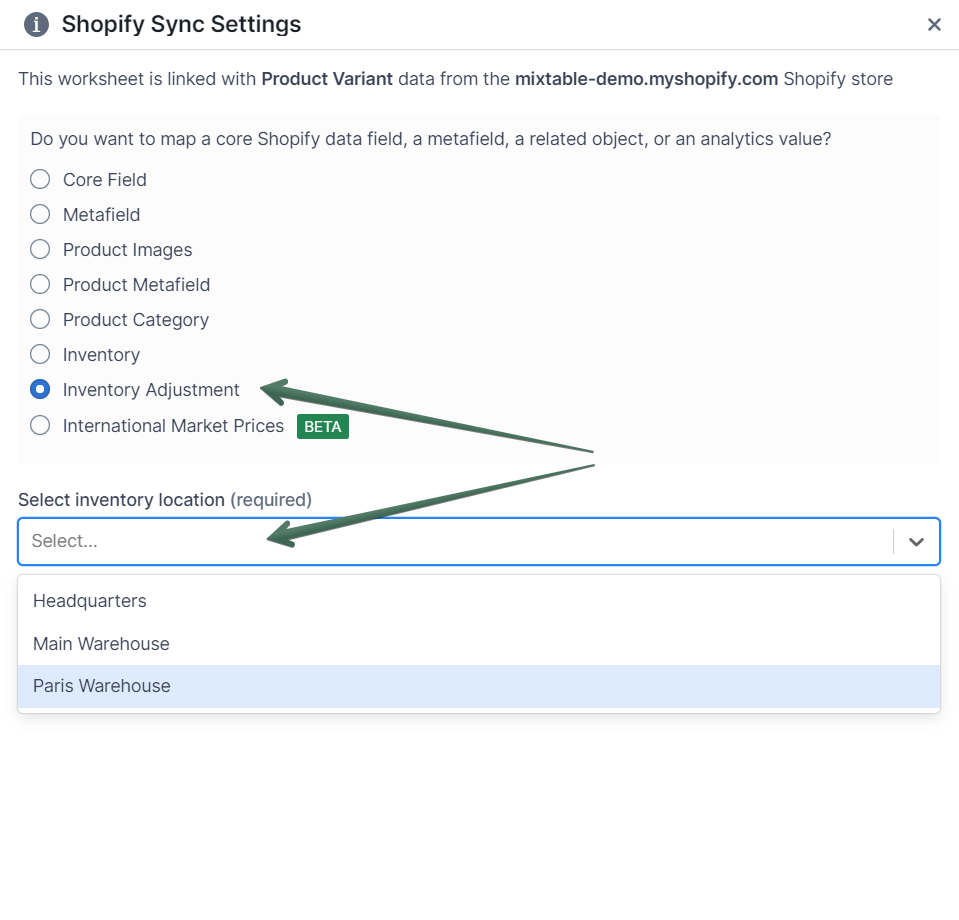
The column starts empty. Enter a positive number to increase stock and a negative number to decrease it, then click Sync.
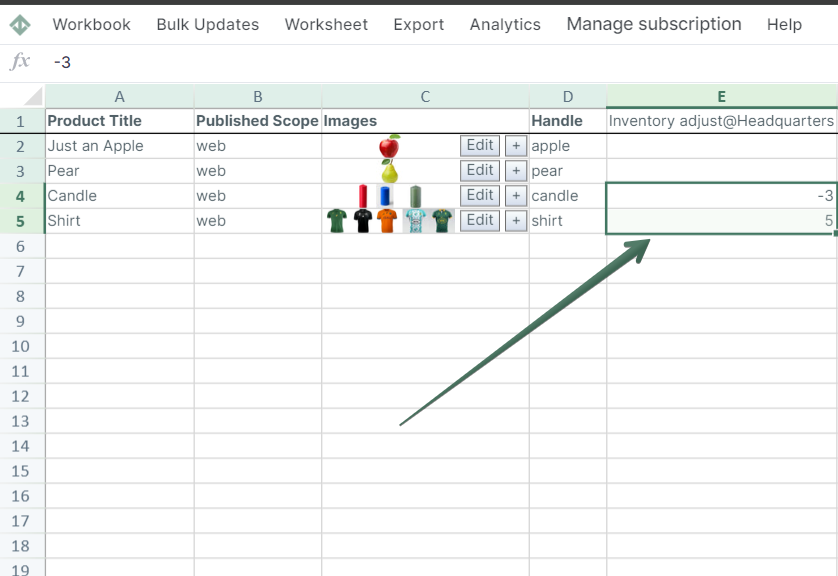
Once an adjustment has been applied, Mixtable clears the cell. That is the correct behavior for a column that describes a change rather than a state, and it means you can never apply the same delivery twice by accident.
Use adjustments when you are recording a real-world event: a delivery arrived, a stocktake found three extra, a pallet was damaged. Use direct values when you have an authoritative count and want the store to match it. There is more detail in Adjust the inventory quantity for your Shopify products.
Manage inventory across multiple locations
Multi-location is where the spreadsheet earns its keep, because it turns a job that the Shopify admin spreads across many screens into one grid.
Map a column for each location, as described above, and you get a matrix: variants down the side, locations across the top, quantities in the middle. From there you can compare stock across your network at a glance, spot the warehouse holding all of a slow seller, move a block of numbers from one location to another by copying and pasting, and edit several locations for the same variant in a single row before syncing once.
The dedicated guide is Manage Shopify inventory across multiple locations.
Use formulas to work out the numbers for you
Inventory columns are real spreadsheet cells, so formulas work on them, and the result of a formula syncs to Shopify exactly like a typed number.
Supply satellite locations from a main warehouse. If two shops are stocked from a central warehouse, a formula can keep the warehouse figure honest as you allocate stock outward, instead of you doing the arithmetic in your head.
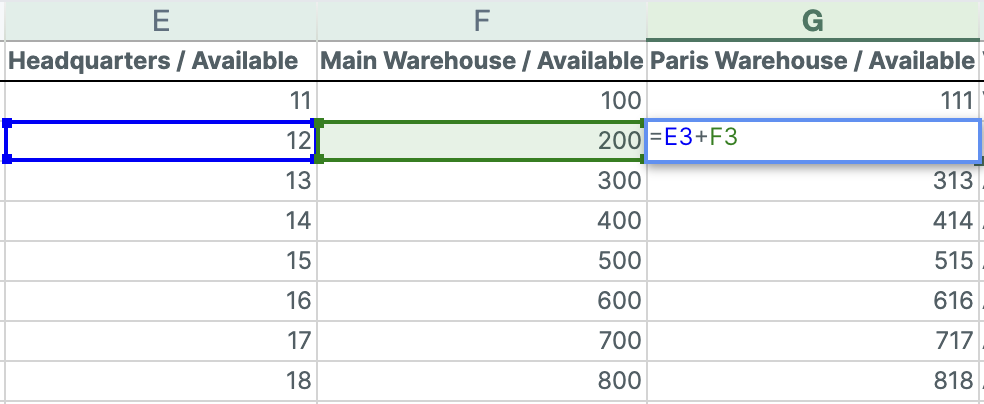
Flag what needs reordering. An IF formula in a spare column turns a wall of numbers into a short list of actions:
=IF(StockColumn<5, "Reorder", "In Stock")
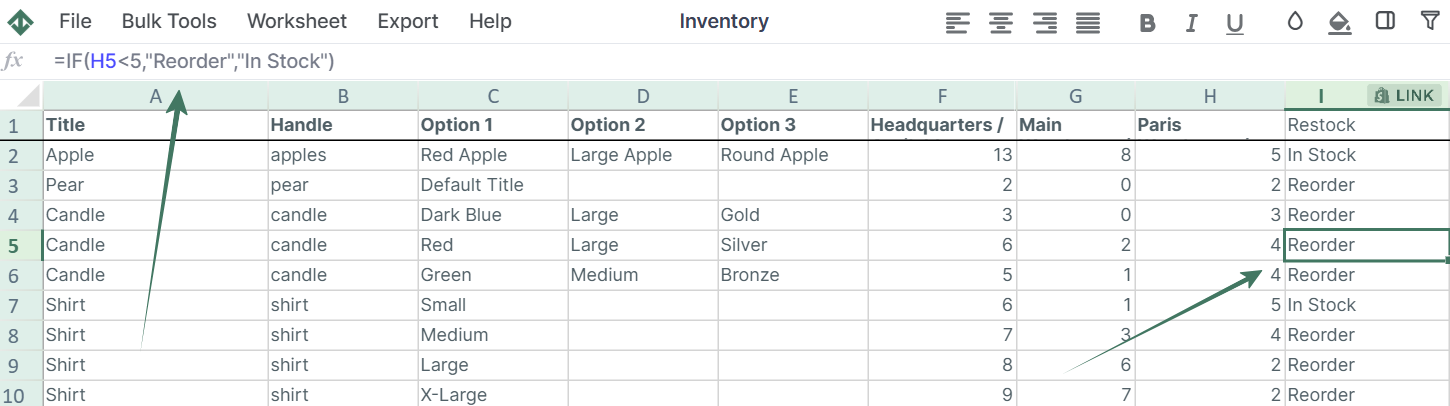
Sort or filter on that column and your reorder list writes itself. The same trick flags overstock, using a high threshold instead of a low one. For stock that isn’t selling at all, the dead stock metrics in inventory history do the counting for you.
To color the stock cells themselves, use conditional formatting. Right-click the stock column’s letter, choose Conditional formatting…, and add a rule such as is less than 5 with a red fill. The colors update whenever the numbers change, including when new stock levels come in from Shopify. See Conditional formatting.
Turn on inventory tracking for many products at once
Shopify will not hold a quantity for a variant unless tracking is on. Doing that product by product in the admin is exactly the sort of job that eats an afternoon. There are two ways to handle it in bulk.
Just set the quantity. If you enter a stock number for a variant that is not currently tracked, Mixtable turns tracking on for you during the sync, then sets the value. This works for both inventory columns and adjustment columns, so most of the time you do not need to think about tracking at all.
Set the tracking field directly. Map a column to the variant field Track quantity and set it to true or false. This is the option to use when you want to audit tracking across the catalog, or turn it off for products that should always be sellable.
Full detail is in Enable Shopify inventory tracking for multiple products.
Decide what happens when stock runs out
Tracking stock is only half the decision. The other half is what your store should do at zero, which Shopify calls the inventory policy.
Map a column to the variant field Continue selling when out of stock and you can set it in bulk. A value of deny stops customers ordering once stock is gone, and continue lets them keep buying, which is what you want for made to order goods, pre-orders, and dropshipped lines. Setting this across a category is a one column edit rather than a hundred visits to the product page.
Import inventory from a CSV
When your stock counts arrive as a file, from a supplier, a warehouse system, or a stocktake app, you can bring them straight in.
- Click Import & Export and choose Import CSV file
- Upload the file
- Match the CSV rows to your worksheet rows on a shared key such as SKU or barcode
- Choose whether to update matching rows only, or to update and add new rows
- Select only the inventory columns you want to change, review the preview, and run the import
The fourth and fifth steps are the ones that matter. Because you choose which columns the import is allowed to touch, an inventory file cannot quietly overwrite your prices, titles, or descriptions. That is the failure mode that makes generic CSV import apps risky, and it is designed out here.
The import updates your worksheet, not your store. Click Sync when you are ready. The full walkthrough is in Import CSV to update or add Shopify data.
Sync inventory from an external system
If your stock lives in an ERP, a warehouse system, or a POS, the same matching mechanism becomes a repeatable routine: export from your system, import into the worksheet on a shared key, update only the inventory cells, sync. It takes minutes once the worksheet is set up, and the worksheet is reusable, so the second time is faster than the first.
Sync inventory from an external inventory management system walks through the whole routine step by step.
Narrow the sheet to the products you care about
A worksheet with every variant in the store is the right starting point, and the wrong thing to work in when you are handling one supplier’s delivery.
Conditional Worksheets fix that. Set criteria and the worksheet only ever contains matching rows, kept up to date as products change. A worksheet of one vendor’s products, or one product type, or items carrying a particular tag, gives you a focused grid where every row is relevant and bulk edits are safe to apply to the whole column. See How to filter Shopify data.
Changes in Shopify flow back into the sheet
Inventory moves while you are looking at it. Orders come in, staff pick stock, other apps write updates.
Mixtable keeps up. When a quantity changes in Shopify, the new number comes into your worksheet automatically, and the cell briefly shows a green border so you can see what changed.
If you have the spreadsheet open when changes arrive from Shopify, Mixtable holds them so nothing shifts around while you're working. The sync control at the top right of the spreadsheet shows how many are waiting, for example Apply 3 updates. Click it to bring them in right away, or close the spreadsheet and they'll come in on their own.
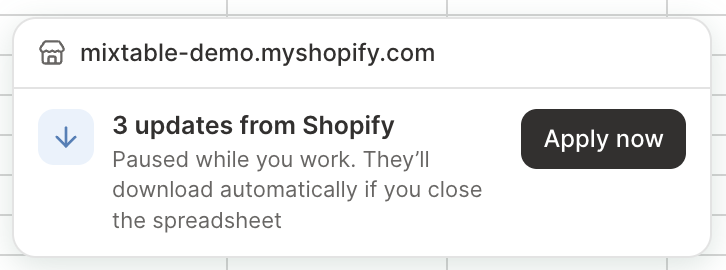
This is the difference between a spreadsheet that reflects your store and an export that started going stale the moment it downloaded.
Preview every change before it reaches Shopify
Before syncing, you can see the complete list of what is about to be sent: which variants, which fields, old value and new value. On a large inventory edit this is the cheapest insurance available, and it is the step that catches a stray paste or a formula that filled further than you intended. See Preview Shopify changes before syncing.
Share and export your inventory
The worksheet can be shared with the people who need it, so a warehouse manager can work in the same live grid as your merchandiser instead of emailing versions of a file back and forth.
When someone needs a file, Import & Export exports the worksheet to Excel or CSV with the inventory columns exactly as you arranged them. See Export Shopify data to Excel.
Everything you can do with inventory in Mixtable
The short version of this section:
- Load stock levels for every variant and location into one grid
- Show any of the eight Shopify quantity states as columns
- Set Available and On hand quantities and sync them back
- Adjust quantities up or down without race conditions
- Edit thousands of cells with bulk number operations, copy and paste, and fill
- Drive stock levels from spreadsheet formulas
- Flag low stock with formulas or conditional formatting
- Turn inventory tracking on or off across the catalog
- Set the out of stock policy in bulk
- Import stock counts from a CSV without touching other fields
- Sync from an external inventory system on a repeatable routine
- Filter to a vendor, product type, or tag with Conditional Worksheets
- See Shopify stock changes come into the sheet automatically
- Preview every change before it is sent
- Share the sheet with your team and export to Excel or CSV
- Put cost, value, and sales metrics next to stock levels
- Look back through day-by-day inventory history to track stock levels, value, stockouts, sell-through, and dead stock over time
Report on inventory: cost, value, and sell-through
Knowing what you hold is one question. Knowing what it is worth and whether it is moving is a different one, and it is the question that decides what you buy next.
Cost per item and inventory value
Map the variant field Cost per item and you can see and bulk edit what each unit costs you. Put it next to a stock column and inventory value is a multiplication away. See Cost per item in Shopify for updating costs in bulk.
Roll variant inventory up to the product level
On a worksheet where each row is a product rather than a variant, Related Data Fields summarize the variants underneath. You’ll find them in the field picker’s Inventory section. Variant stock can be added up, averaged, or reduced to the smallest or largest number, and Inventory value gives you quantity multiplied by unit cost across the variants.
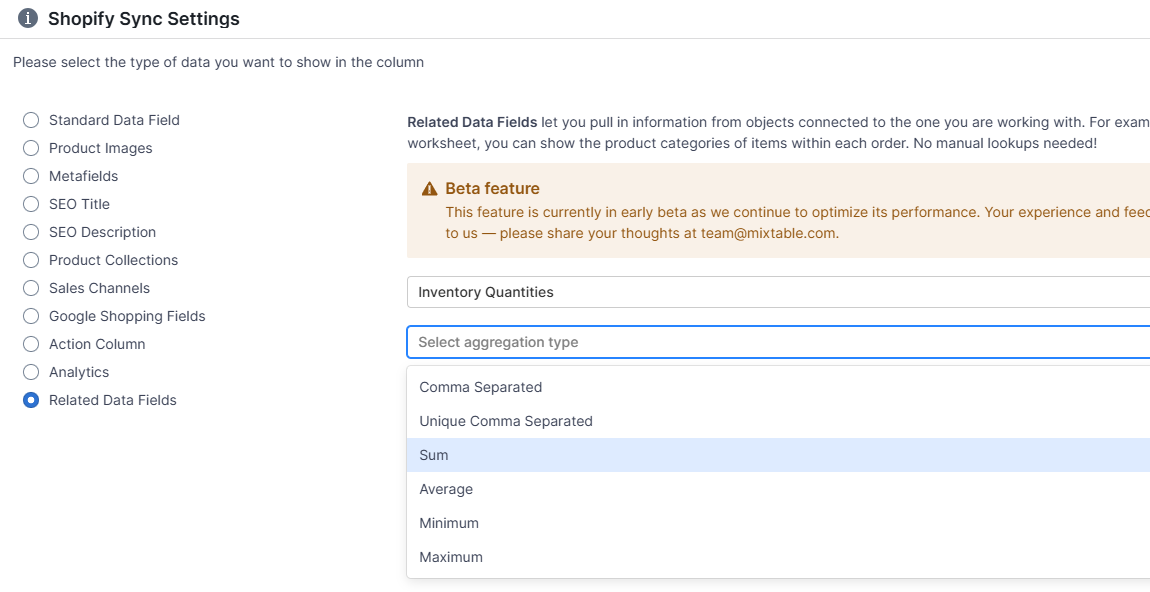
A product level sheet with total units and total value is the view for a buying conversation, where six rows for six sizes are noise. See Related data fields.
Put sales metrics next to stock levels
Stock counts alone cannot tell you the difference between a healthy buffer and dead stock. Analytics columns add the sales side to the same rows: Net Quantity Sold, Amount of Cost of Goods Sold, net sales, gross profit, and gross margin, over the period you choose.
With units sold and units held in adjacent columns, sell-through and weeks of cover are simple formulas, and the answer to “what should I reorder” stops being a guess. See Add analytics columns to a Shopify data worksheet.
Start from the Variant margin and inventory template
If you would rather not assemble that by hand, the Variant margin & inventory worksheet template builds it: title, SKU, price, cost, and inventory alongside cost of goods sold, gross profit, gross margin, net sales, and net quantity sold.
Shopify inventory history
Everything above starts from today’s stock. Plenty of inventory questions are about the past, though. How much did you hold at the end of last month, and what was it worth? Which variants sold out, and for how many days? Is a product moving, or has it sat untouched all season?
Mixtable Analytics Spreadsheet answers these from your store’s inventory history. It downloads the day-by-day stock of every tracked variant at each of your locations from Shopify, then calculates inventory metrics from it, so last month’s stock can sit right next to today’s in the same spreadsheet.
What you can track with inventory history
- Stock levels on a past day or over a period. Opening Stock, Closing Stock, Stock Change, and Average Daily Stock show how many units you held and how that changed
- Inventory value. Closing Value at Cost and Closing Value at Retail show what the stock you held on a given day was worth
- Stockouts. Days Out of Stock, In-Stock Rate, Out-of-Stock Variants, Last In-Stock Date, and Estimated Lost Sales show how often products sold out and what that probably cost you
- Sell-through and dead stock. Sell-Through Rate, Inventory Turnover, Days of Stock Left, Dead Stock Units, and Dead Stock Value at Cost show what is moving and what is tying up cash
See how much stock you held on a past day
For example, here is how to add a column showing each variant’s stock at the end of a past day, such as the last day of last month.
-
Open a Products (with variants) worksheet. To add one, click the + at the end of the worksheet tabs, or choose Worksheet > Add worksheet…
-
Click + Shopify data in the header row of an empty column, or choose Column > Add Shopify data… from the menu bar. The field picker opens
-
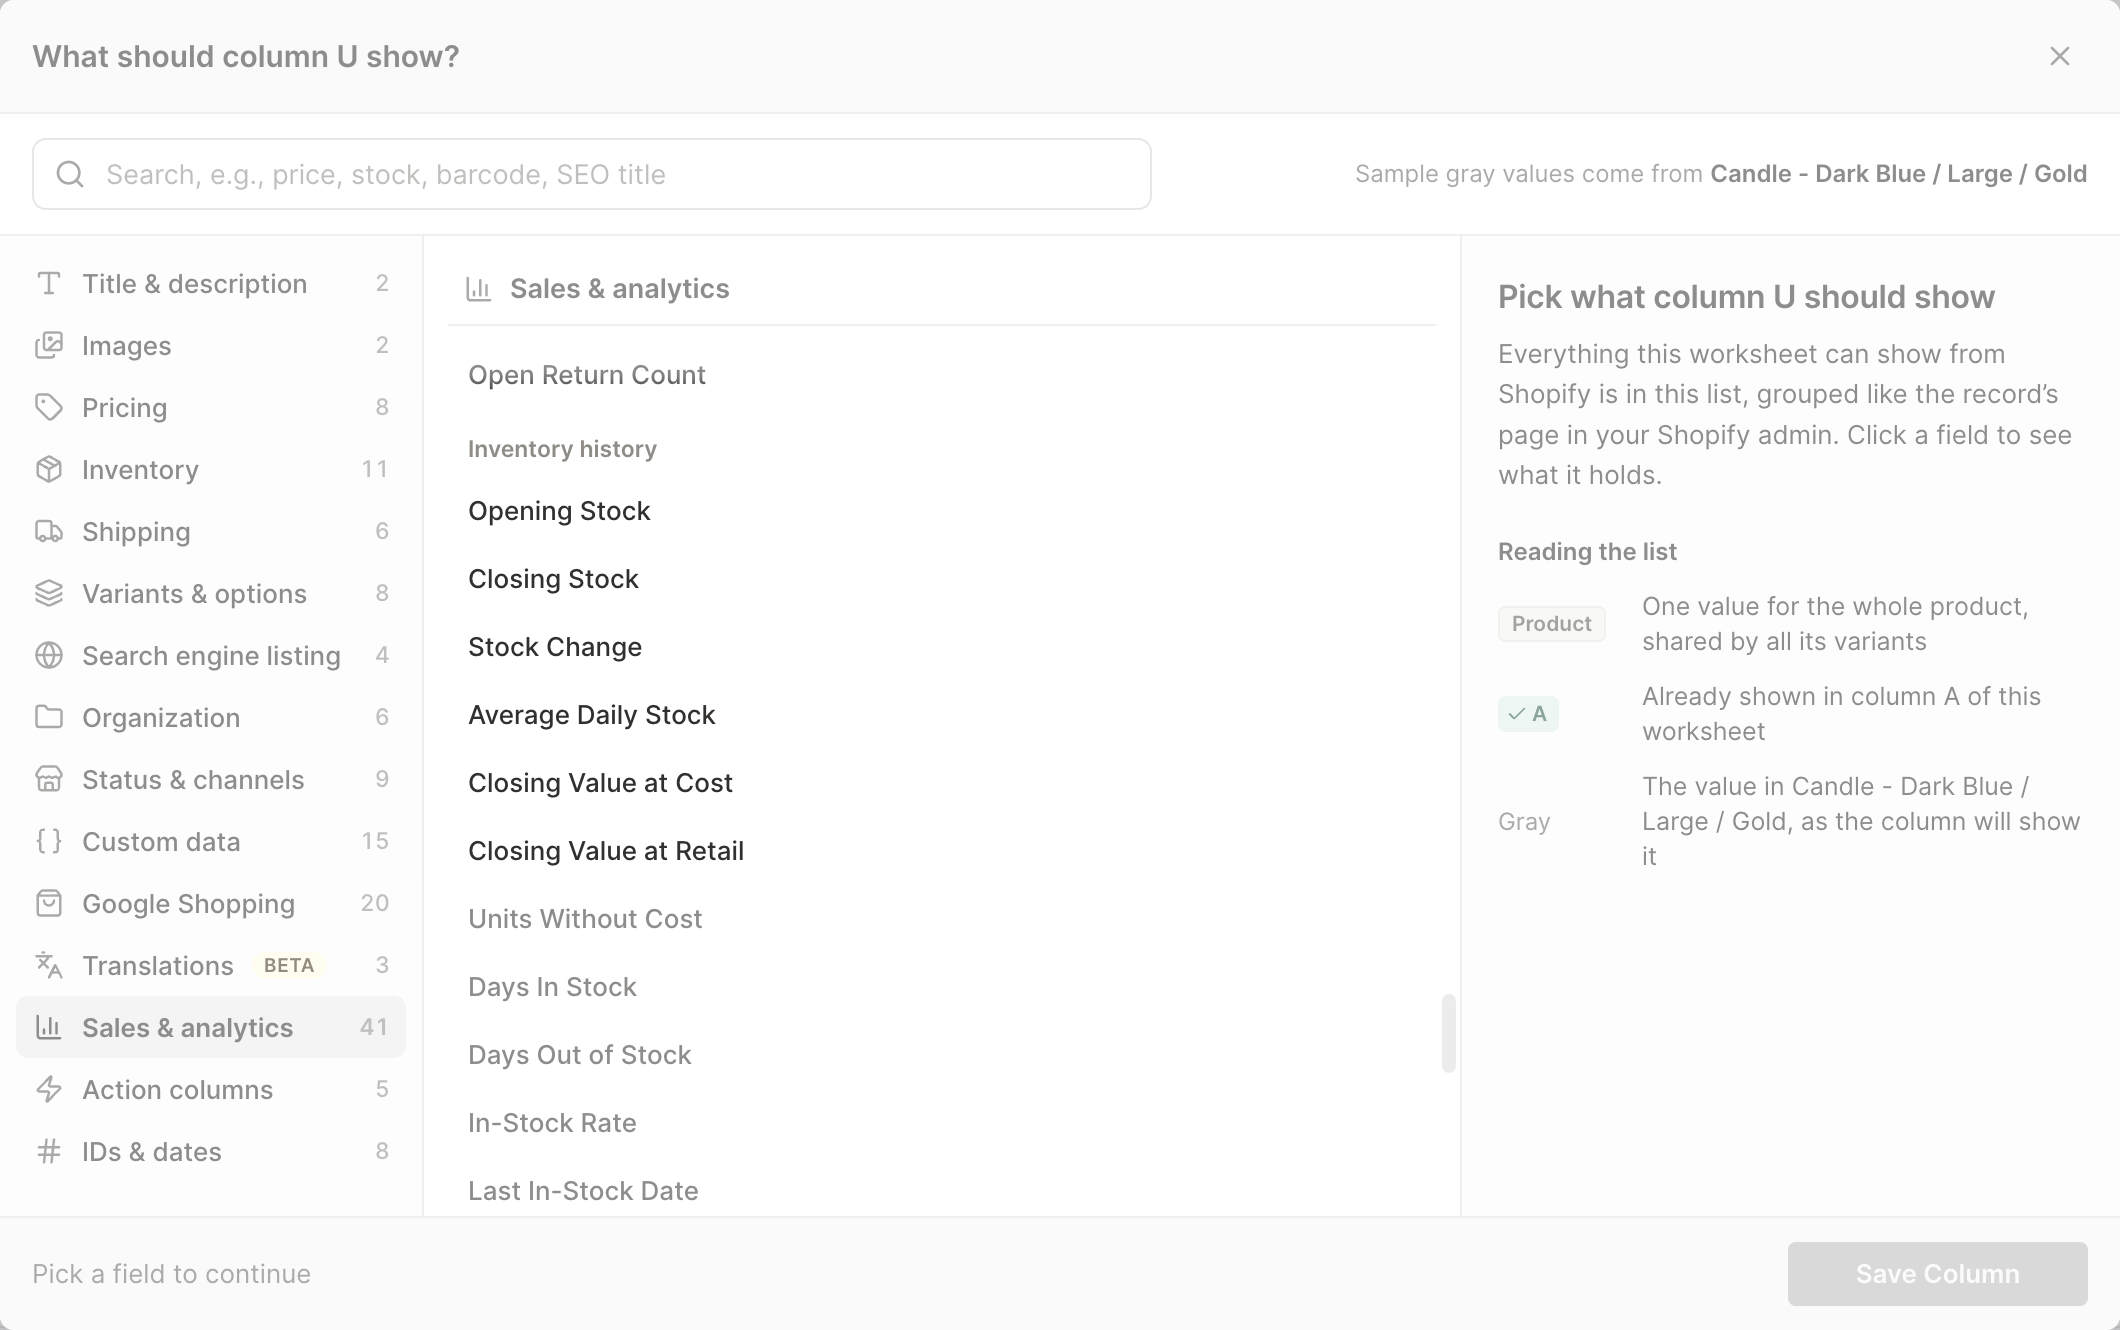
Click Sales & analytics in the list of sections on the left, then scroll down to the Inventory history group. You can also type part of the metric's name in the search box
-
Click Closing Stock. The metric's settings open with it already chosen under Which metric?
-
Pick the dates. Most metrics ask Over what time period?: choose Fixed dates, Rolling period, Calendar year, or Calendar month, then pick the dates. Metrics that describe a single day ask On what date? instead: choose Fixed date, Rolling date, Calendar year, or Calendar month, then pick the day
-
Under Which stock locations count, leave it as it is to count every location. To count only some, click + Add filter, choose Stock location, and pick a location. Click + Add filter again to add another one. Days of Stock Left, Estimated Lost Sales, Sell-Through Rate, and Inventory Turnover always count every location, because sales aren't split by stock location, so this step has nothing to pick for them
-
Click Save Column
Put the new column beside a live Available column and you can compare where each variant stood then with where it stands now. The first time you add an inventory metric, Mixtable may still be downloading your history. Until it finishes, the cells read Waiting for inventory history and fill in on their own.
Break stock history down by location, vendor, or month
To total stock for groups instead of single variants, use a Reporting worksheet. A Pivot Table worksheet can show stock, value, and stockouts by location, vendor, or product type, and a Time Series worksheet shows how those numbers changed month by month.
How far back the history goes
Inventory history starts on October 1, 2023, the earliest day Shopify keeps it, or when your store was created if that was later. It runs to yesterday, because today’s stock isn’t final until the day ends. For the stock you hold right now, use a regular inventory column.
Stock quantities aren’t part of Cell history, so on an inventory cell it says “Mixtable doesn’t keep history for this field.” Inventory metrics are the place to look for stock over time. Start with the inventory analytics guide, or go straight to the metrics for stock levels and inventory value, stockouts and availability, or sell-through, turnover, and dead stock.
How to manage inventory in the Shopify admin
Everything above has a Shopify admin equivalent. It is worth knowing, both because you will use it for one-off changes and because the contrast explains when a spreadsheet is the better tool.
Note: Shopify moves things around in the admin from time to time, so a menu may sit somewhere slightly different from what is described here. The concepts are stable even when the layout is not.
Turn on inventory tracking for a product
Open the product, find the Inventory section, and tick Track quantity. Until you do, Shopify holds no stock number for that variant. The same section holds Continue selling when out of stock, which is the inventory policy described earlier.
You do this per product, and on a product with variants you may need to handle each variant.
Update the stock of a single product
Go to Products and then Inventory for a list of your variants with their SKU and quantity states. Find the row, edit the quantity, and save.
The list lets you switch between setting a new total and adding an adjustment, which is the same distinction Mixtable draws between inventory columns and adjustment columns.
Update stock at more than one location
The Inventory page shows one location at a time, chosen from a dropdown. To update the same variant at three locations you switch location, find the variant, edit, then repeat. There is no view that puts a variant’s locations side by side for editing, which is the single biggest reason multi-location merchants outgrow the admin.
Bulk edit inventory in the admin
Two options exist for changing several things at once.
The bulk editor. Select products on the Products page and choose Bulk edit for a grid where you can add columns and edit a screen’s worth of values. It is genuinely useful for small batches. It has no formulas, no fill down, no percentage operations, and no way to preview a change set before it commits, and it is oriented around the products you selected rather than your whole catalog.
Inventory CSV export and import. The Inventory page can export a CSV and import one back. This handles volume, but it is the round trip that causes trouble: you export, the file starts going stale immediately, you edit it in a spreadsheet with no connection to your store, and you import it back hoping the columns line up. There is no live view, and mistakes are found after they are applied rather than before.
Move stock between locations
Shopify supports transfers for moving stock from one location to another, which is the right tool when goods are physically travelling and you want incoming quantities to reflect that. Transfers track the journey rather than simply editing two numbers, so for genuine warehouse to shop movements they are worth using.
Look up a variant’s inventory history
Open a product, click a variant if it has them, and click View adjustment history in the Inventory section. Shopify lists each change with its date, what caused it (an order, a transfer, or a staff edit, for example), and the quantities left afterward.
This is the right place to answer “what happened to this variant?” It covers one variant at a time and only the last 180 days, though, so a question like “how much stock did we hold across the store at the end of March?” means opening every variant in turn. For that kind of question, see Shopify inventory history above.
Where the admin runs out of road
The Shopify admin is well built for the job it was designed for: changing one thing, carefully, with full context. It struggles when the job is shaped differently, when you need to see a thousand variants at once, compare locations side by side, apply the same change to a category, drive numbers from a formula, or bring in a supplier’s file without risking the rest of your catalog.
| Job | Shopify admin | Mixtable |
|---|---|---|
| Change stock for one variant | Fine | Fine |
| See every variant and location in one grid | One location at a time | All locations as columns |
| Update hundreds of variants | Bulk editor, small batches, or a CSV round trip | Edit and sync in one pass |
| Apply a percentage change to a column | Not available | Bulk edit numbers |
| Drive stock from a formula | Not available | Standard spreadsheet formulas |
| Import a supplier file safely | CSV import, whole file | Match on SKU, update chosen columns only |
| Preview a change set before it applies | Not available | Preview changes before sync |
| See live changes from your store | Refresh the page | Cells update as they change |
| Stock next to sales and margin | Separate reports | Analytics columns on the same rows |
| See stock levels on a past day | Adjustment history, one variant at a time, last 180 days | Day-by-day stock history for every variant |
None of this makes the admin the wrong tool. It makes it a tool for a different size of job, and knowing which job you have is most of the skill.
Why Shopify inventory management matters
Beyond the mechanics, inventory decisions show up directly in cash, margin, and whether customers come back.
It protects your cash. Stock is money you have already spent and cannot spend again. Every unit sitting in a warehouse longer than it needs to is capital you could have put into the products that are actually selling, or into acquiring customers.
It controls storage costs. Warehousing usually scales with volume, so holding more than you need costs money every month, and slow moving stock costs the most because it pays rent longest.
It prevents overselling. Selling something you cannot ship is the most expensive kind of stockout, because you have already taken the customer’s money and now have to disappoint them. Accurate quantities across every location and channel are what stop it happening.
It prevents stockouts on the products that matter. Running out of a best seller is a lost sale and often a lost customer, who will find your competitor while looking for the thing you did not have.
It makes forecasting possible. Once stock history and sales history are reliable, you can see how demand moves through the year and buy for the season you are entering rather than the one you just left. Without trustworthy inventory data, forecasting is guessing with extra steps.
Shopify inventory management best practices
Segment your catalog. Not all stock deserves the same attention. Split products by how fast they sell and how much they are worth, and you will find a small group that drives most of your revenue and needs watching weekly, and a long tail that needs checking occasionally. Managing both the same way wastes effort on one and starves the other.
Keep quantities current. The value of inventory data collapses as it ages. A number that was right last Tuesday tells you almost nothing today. This is the argument for working from a live view of your store rather than an export, because an export is out of date before you have finished opening it.
Audit on a schedule. Recorded stock drifts from physical stock through shrinkage, damage, mispicks, and returns. Counting regularly, whether that is a full count once a year or a rolling cycle count, is what keeps the drift small enough to correct. A spreadsheet that shows counted and recorded quantities side by side turns the reconciliation into a single pass.
Watch stock and sales together. Stock levels alone cannot distinguish a healthy buffer from dead stock. Units sold over a recent period in the next column tells you which is which, and turns a reorder decision into arithmetic.
Set reorder points and let them do the work. Deciding the threshold once, per product, and flagging anything that crosses it beats re-reading the whole catalog every week. A formula in a spare column will do this permanently.
Improve your forecasting deliberately. Your own sales history is the best demand signal you have. Compare what you predicted against what happened, adjust, and repeat. Forecasting is a skill that compounds, and every point of accuracy is cash you did not tie up.
Frequently asked questions
Does Shopify track inventory on products or variants? On variants. Shopify creates a variant for every product even when you have not defined any options, so inventory is always held against a variant. This is why inventory work happens on worksheets where each row is a variant.
Can I update inventory at several locations at the same time? Yes. Map a column per location and each row shows that variant’s stock everywhere. Edit as many cells across as many locations as you like, then sync once.
What is the difference between setting inventory and adjusting it? Setting states the total the quantity should become. Adjusting states the change to apply to whatever the current total is. Adjustments are safer when stock is moving, because a sale between your edit and the sync is accounted for rather than overwritten.
Which quantity states can Mixtable write back to Shopify? Available and On hand. The others, including Committed, Incoming, Reserved, Damaged, Safety stock, and Quantity control, can be brought into the spreadsheet to look at but are maintained by Shopify.
Do I have to turn on inventory tracking before I can set quantities? No. If you set a quantity for a variant that is not tracked, Mixtable turns tracking on during the sync and then applies your value. You can also set the tracking field directly if you want to control it explicitly.
Does editing a cell change my store straight away? No. Edited cells turn yellow and stay in Mixtable until you click Sync. You can preview the full set of pending changes before sending them.
Can I update inventory from a file my supplier sends? Yes. Import the CSV, match rows on SKU, barcode, or option values, and select only the inventory columns you want changed. Nothing outside those columns is touched.
Can I see stock and sales in the same view? Yes. Analytics columns add metrics such as Net Quantity Sold and cost of goods sold to the rows you are already looking at, so sell-through and cover are simple formulas next to your stock levels.
Can I see my Shopify inventory history? Yes. Mixtable Analytics Spreadsheet downloads your store’s day-by-day stock history from Shopify, so you can see how much of each variant you held on a past day, what it was worth, and how often it sold out. In the Shopify admin, a variant’s adjustment history shows the last 180 days of changes, one variant at a time.